by Joche Ojeda | Apr 29, 2026 | A.I, Local Model Adventures
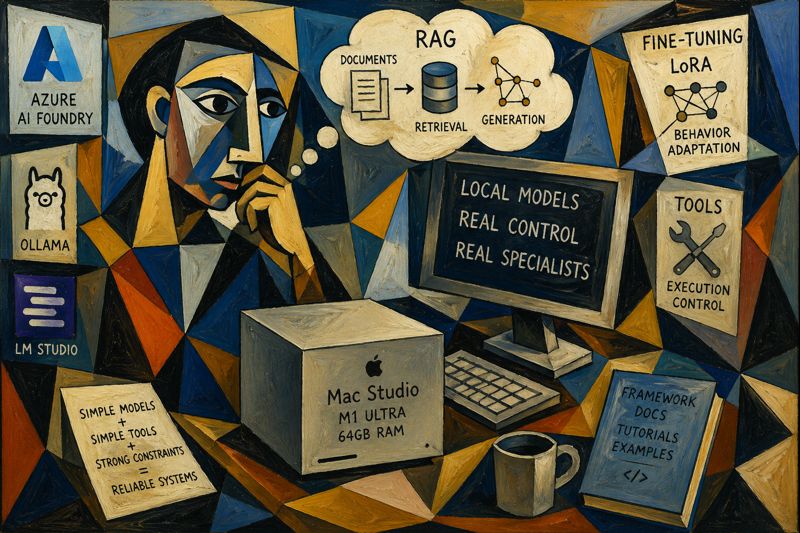
I was recently in Arizona and got my hands on a Mac Studio (M1 Ultra, 64GB RAM).
Naturally, I didn’t use it for video editing or music production. I used it for what actually matters:
Running local AI models and trying to bend them to my will.
The Setup
I went all-in and installed three main tools:
The goal was simple:
Try every possible way to make open-source models behave like something useful.
Not just chatting. Not just “vibe coding.” Actual controlled behavior.
The Reality Check
After working with frontier models like those from OpenAI and Anthropic, one thing becomes obvious:
They’re just better.
Not because of magic.
Because of:
- more training data
- better curated data
- more compute
- more iterations
- better eval loops
It’s not one thing. It’s everything combined.
You feel it immediately:
- better reasoning
- better language coverage
- better consistency
- fewer weird edge cases
So What’s the Point of Local Models?
This is where things get interesting.
Instead of trying to compete with frontier models, I flipped the approach:
Don’t build a general intelligence. Build a specialist.
The Core Idea: Single-Task Specialists
Instead of asking:
“How do I make this model as good as GPT or Claude?”
Ask:
“How do I make this model extremely good at ONE thing?”
That changes everything.
The Stack of Techniques
1. Base Model Selection
Small to mid-size models:
- 7B–8B range works best locally
2. RAG (Retrieval-Augmented Generation)
Inject knowledge at runtime:
- docs
- codebases
- tutorials
- architecture notes
3. Behavior Tuning (LoRA / fine-tuning)
Instead of teaching knowledge, teach patterns:
- how to respond
- how to structure outputs
- how to write code
- how to fix bugs
4. Tooling / Skills
Give the model bounded capabilities:
- limited toolset
- deterministic flows
- controlled execution
The Big Insight
The breakthrough for me was this:
Knowledge ≠ Behavior
You don’t train the model to know everything. You train it to behave correctly within a narrow domain.
Example: Framework Specialist
Let’s say you take a framework like DevExpress XAF.
You can build a local specialist by combining:
Knowledge Layer (RAG)
- official docs
- tutorials
- your internal patterns
- real-world examples
Behavior Layer (fine-tuning)
- “user asks → correct implementation”
- “buggy code → fixed code”
- “requirement → test → solution”
Tool Layer
- code generation
- validation scripts
- test runners
Now instead of a generic model, you get:
A XAF expert agent that runs locally.
Why This Works
Because you’re not fighting the limitations anymore.
You’re embracing them.
Small models:
- are faster
- are cheaper
- are controllable
- are predictable
And when you narrow the scope:
They become surprisingly good.
The Direction I’m Exploring
What really got my attention is this idea:
Simple models + simple tools + strong constraints = reliable systems
Not:
- giant models
- huge toolchains
- uncontrolled agents
But:
- small models
- few tools
- explicit rules
- tight loops
What’s Next
I’m going to keep experimenting and document everything:
- different models (Qwen, Llama, etc.)
- different training approaches (LoRA, no training, RAG-only)
- different tool strategies
- evaluation setups
- failure cases (this is the important part)
Final Thought
Frontier models are incredible.
But local models are hackable.
And that’s the real advantage.
You can shape them.
You can constrain them.
You can turn them into specialists.
And for real-world systems, that might actually be more valuable than raw intelligence.

by Joche Ojeda | Mar 26, 2026 | A.I
After discovering that tools were silently burning my context window, I had a new problem:
How do I keep powerful agents without paying the cost of massive schemas?
The answer did not come from AI.
It came from something much older.
👉 The command line.
🧠 The Problem with Traditional Tools
Most agent tools today are defined with JSON schemas, nested parameters, verbose descriptions, and strict typing.
They look clean to us as developers.
But to an LLM?
👉 They are heavy prompt payloads.
Every request includes:
- full schema
- all parameters
- all descriptions
Even if the user only says:
“order coffee”
💥 Why This Does Not Scale
Let’s say you have:
- 30 tools
- each with 800 tokens
That means:
👉 24,000 tokens before the user even speaks
And most of those tokens are:
- never used
- rarely relevant
- repeated every time
🔍 Rethinking Tools
So I asked myself:
Do tools really need to be JSON schemas?
Or…
👉 Do they just need to be understandable commands?
⚡ Enter CLI-Style Tools
Instead of this:
{
  "name": "create_order",
  "parameters": {
    "userId": "...",
    "productId": "...",
    "quantity": "..."
  }
}
You define tools like this:
create_order uid pid qty
Or even:
order coffee size=large sugar=0
🧬 Why This Works
Because LLMs are incredibly good at:
- parsing text
- understanding intent
- filling structured patterns
You do not need:
- deep JSON
- verbose schemas
- long descriptions
👉 You just need clear syntax
📉 Token Cost Comparison
JSON Tool
~800–1500 tokens
CLI Tool
~10–30 tokens
👉 That is a 50x–100x reduction
🧠 Less Structure, Better Reasoning
With CLI tools:
- fewer tokens means more room for conversation
- simpler format means easier decisions
- less noise means better accuracy
The model does not need to:
- parse nested JSON
- match schemas
- validate deep structures
It just:
👉 generates a command
⚙️ How It Looks in Practice
User says:
“I want a large coffee with no sugar”
Agent outputs:
order_coffee size=large sugar=0
Your backend:
- parses the string
- validates parameters
- executes the action
🧩 You Move Complexity Out of the Model
This is the key shift:
Before:
- the model handles structure
- the model handles validation
- the model handles formatting
After:
- the model generates intent
- your code handles everything else
👉 Which is exactly what we want as engineers
🚀 Benefits for Real Systems
If you are building something like:
- WhatsApp or Telegram agents
- multi-domain assistants
CLI tools give you:
- massive token savings
- faster responses
- lower cost per user
- better scalability
- simpler tool definitions
⚠️ Trade-offs
CLI tools are not magic.
You lose:
- strict schema validation in the prompt
- automatic argument formatting
- some guardrails
So you must:
- validate inputs in your backend
- handle errors gracefully
- design clean command syntax
🧠 Best Practices
1. Keep commands short
order_coffee
book_yoga
pay_invoice
2. Use key=value pairs
book_yoga date=2026-03-28 time=10:00
3. Avoid ambiguity
Bad:
order stuff
Good:
order_food item=pizza size=large
4. Build a parser layer in C#
This fits perfectly with a .NET stack:
- Regex or tokenizer
- map to DTO
- validate
- execute
5. Combine with routing
The best setup looks like this:
Router → Domain → CLI tools
Now you get:
- small toolsets
- tiny prompts
- efficient agents
💡 The Big Insight
After all this, I realized:
JSON schemas are for machines.
CLI commands are for language models.
🏁 Conclusion
The goal is not to remove tools.
The goal is to:
👉 make tools cheaper to think about
CLI-style tools:
- reduce tokens
- simplify reasoning
- scale better
And most importantly:
They let your agent focus on what actually matters — understanding the user.

by Joche Ojeda | Mar 26, 2026 | A.I
After testing OpenClaw, something clicked.
The future is not chat.
👉 The future is agents.
🛠️ Building the “Perfect” Agent
I started designing what I thought would be the ultimate assistant:
- General purpose
- Connected to everything
- Capable of doing real tasks
And to make that happen…
I built tools.
A lot of tools.
Not generic ones — very specific tools:
- booking flows
- ordering systems
- logistics
- payments
- daily life actions
Before I knew it…
👉 My agent had around 50 custom tools
And honestly, it felt powerful.
💡 The Business Idea
The plan was simple:
- Give users a few free tokens per day
- Let them try the agent
- Hook them with real utility
A classic freemium model.
💥 Reality Hit Immediately
What actually happened?
Users would send:
“Hello”
…and then…
👉 Quota exceeded
Not after a conversation.
Not after a task.
After the second request.
🤨 That Made No Sense
At first, I thought:
- Maybe there’s a bug
- Maybe token counting is wrong
- Maybe pricing is off
But everything checked out.
Still:
- almost no conversation
- almost no output
- quota gone
🧠 That’s When I Started Digging
So I did what we always do:
👉 I looked under the hood
And what I found changed how I think about agents completely.
🔍 The Hidden Cost of Tools
I realized something critical:
My agent wasn’t just sending messages.
It was sending all 50 tools on every request.
Every. Single. Time.
📦 What That Actually Means
Each tool had:
- name
- description
- parameters
- JSON schema
- nested objects
Individually? Fine.
Together?
👉 Massive.
So even a simple request like:
“Hello”
Was actually being processed like:
[system prompt]
[conversation]
[50 tool definitions]
[user: Hello]
🔥 I Was Burning Tokens Without Knowing
That’s when it clicked.
The user wasn’t paying for:
They were paying for:
👉 the entire toolset injected into the prompt
📉 Why My Quota Disappeared Instantly
Let’s do the math.
- each tool ≈ 600–1000 tokens
- I had ~50 tools
👉 I was sending 30,000–50,000 tokens per request
For a “Hello”.
No wonder the quota was gone after two messages.
😳 The Illusion of “Light Usage”
From the user’s perspective:
- they typed almost nothing
- they got almost nothing
From the system’s perspective:
👉 It processed a massive prompt
🧬 The Realization
That’s when I understood:
Tools are not just capabilities.
Tools are context weight.
Every tool:
- consumes tokens
- competes for attention
- increases cost
⚠️ The Bigger Problem
It wasn’t just cost.
The agent was also:
- slower
- less accurate
- sometimes picking the wrong tool
Because it had to:
👉 reason over 50 options every time
🧠 The Shift in Thinking
Before:
“More tools = smarter agent”
After:
“More tools = heavier prompt = worse performance”
🚀 What This Changed for Me
I stopped trying to build:
❌ One agent that does everything
And started designing:
✅ Systems that load only what’s needed
🧩 The New Approach
Instead of:
Agent → 50 tools
I moved to:
User → Router → Domain Agent → 5 tools
Now:
- smaller prompts
- lower cost
- better decisions
💡 Final Insight
That experience taught me something simple but powerful:
If your agent feels expensive, slow, or dumb…
check how many tools you’re injecting into the prompt.
Because sometimes:
👉 You’re not scaling intelligence
👉 You’re scaling tokens
🏁 Closing
That “Hello → quota exceeded” moment was frustrating.
But it revealed a fundamental truth about agents:
The problem is not how many tools you have.
The problem is how many you send every time.
And once you see that…
You start building agents very differently.
by Joche Ojeda | Feb 16, 2026 | CLI, Github Copilot, SDK
This guide covers how to integrate the GitHub Copilot SDK (GitHub.Copilot.SDK) into .NET applications and how to bridge it to the Microsoft.Extensions.AI.IChatClient abstraction so that any UI component — DevExpress DxAIChat, a Blazor chat page, a WinForms control, or any consumer that depends on IChatClient — can route messages through GitHub Copilot’s LLM backend transparently.
The guide walks through every layer of the SDK: client lifecycle, session management, event-driven streaming, tool/function calling with AIFunctionFactory, hooks, permissions, user input requests, context compaction, skills, MCP servers, custom agents, and finally the IChatClient adapter pattern that makes the SDK a drop-in backend for Microsoft.Extensions.AI.
What you will be able to do after this guide:
- Create and manage a
CopilotClient lifecycle (start, ping, status, auth, list models, stop, dispose).
- Open stateful sessions with model selection, streaming, and system messages.
- Register custom C# tools (
AIFunction) that the model calls autonomously.
- Intercept tool calls with pre/post hooks and permission handlers.
- Request user input from the model via
OnUserInputRequest.
- Enable infinite sessions with context compaction.
- Load skill directories (
SKILL.md) to shape model behavior.
- Configure MCP servers and custom agents on a session.
- Wrap
CopilotChatService in an IChatClient adapter (CopilotChatClient) for seamless DI integration.
- Register everything through a single
AddCopilotSdk() extension method.
[[[MERMAIDBLOCK0]]]
Prerequisites
| Requirement |
Minimum Version |
Notes |
| .NET SDK |
8.0 |
.NET 9 / 10 also supported |
GitHub.Copilot.SDK |
0.1.23 |
The official GitHub Copilot SDK NuGet package |
Microsoft.Extensions.AI |
latest |
The IChatClient abstraction from Microsoft |
| GitHub authentication |
— |
Either VS Code / GitHub CLI logged-in user, or a GitHub Personal Access Token |
| IDE |
Visual Studio 2022 17.8+ or VS Code with C# Dev Kit |
|
| OS |
Windows, macOS, or Linux |
|
Optional but recommended:
| Package |
Version |
Purpose |
Microsoft.Extensions.Logging.Console |
latest |
Console logging for the SDK |
Markdig |
0.38+ |
Server-side Markdown → HTML rendering |
HtmlSanitizer |
8.* |
Prevent XSS in rendered HTML |
Quick Start — Console App
1. Create a console project
dotnet new console -n MyCopilotApp
cd MyCopilotApp
2. Install packages
dotnet add package GitHub.Copilot.SDK --version 0.1.23
dotnet add package Microsoft.Extensions.AI
dotnet add package Microsoft.Extensions.Logging.Console
3. Minimal Program.cs
using GitHub.Copilot.SDK;
using Microsoft.Extensions.Logging;

using var loggerFactory = LoggerFactory.Create(b =>
    b.AddConsole().SetMinimumLevel(LogLevel.Warning));
var logger = loggerFactory.CreateLogger<CopilotClient>();

// 1. Create the client
var client = new CopilotClient(new CopilotClientOptions
{
    UseLoggedInUser = true,   // Use VS Code / gh CLI logged-in user
    Logger = logger
});

// 2. Start
await client.StartAsync();
Console.WriteLine($"State: {client.State}");

// 3. Create a session and ask a question
await using var session = await client.CreateSessionAsync(new SessionConfig
{
    Model = "gpt-4o"
});

var answer = await session.SendAndWaitAsync(
    new MessageOptions { Prompt = "What is the capital of France?" });
Console.WriteLine($"Answer: {answer?.Data.Content}");

// 4. Cleanup
await client.StopAsync();
await client.DisposeAsync();
4. Run
Prerequisite: You must be logged in to GitHub via VS Code or gh auth login.
Project Structure (.csproj)
<Project Sdk="Microsoft.NET.Sdk">
  <PropertyGroup>
    <OutputType>Exe</OutputType>
    <TargetFramework>net8.0</TargetFramework>
    <ImplicitUsings>enable</ImplicitUsings>
    <Nullable>enable</Nullable>
  </PropertyGroup>
  <ItemGroup>
    <PackageReference Include="GitHub.Copilot.SDK" Version="0.1.23" />
    <PackageReference Include="Microsoft.Extensions.AI" Version="*" />
    <PackageReference Include="Microsoft.Extensions.Logging.Console" Version="*" />
  </ItemGroup>
</Project>
Core Concepts
1. CopilotClient — The Entry Point
CopilotClient manages the underlying Copilot process (Stdio transport), authentication, and model discovery. You must start it before creating any sessions.
var client = new CopilotClient(new CopilotClientOptions
{
    UseLoggedInUser = true,          // Use VS Code / gh CLI auth
    // GithubToken = "ghp_...",       // Or use a PAT directly
    // CliPath = "/path/to/copilot",  // Custom CLI binary path
    Logger = logger
});
Client Lifecycle
Created → Starting → Running → Stopping → Stopped
                                  ↑ ForceStop (immediate)
| Method |
Purpose |
StartAsync() |
Start the Copilot process, establish connection |
PingAsync(message) |
Verify the connection is alive |
GetStatusAsync() |
Get version and protocol version |
GetAuthStatusAsync() |
Check auth type and authentication status |
ListModelsAsync() |
List all available models with capabilities |
StopAsync() |
Graceful shutdown — waits for cleanup |
ForceStopAsync() |
Hard kill — skips cleanup |
DisposeAsync() |
Release all resources (always call after stop) |
Authentication Options
| Option |
How |
| VS Code logged-in user |
Set UseLoggedInUser = true (default). Requires being logged into GitHub in VS Code or via gh auth login. |
| GitHub Personal Access Token |
Set GithubToken = "ghp_...". Overrides UseLoggedInUser. |
| Custom CLI path |
Set CliPath to point to a custom Copilot CLI binary. |
Listing Models
var models = await client.ListModelsAsync();
foreach (var m in models)
{
    Console.WriteLine($"{m.Id,-35} {m.Name,-25} {m.Capabilities}");
}
2. CopilotSession — Stateful Conversations
A session represents a single conversation. Sessions are stateful — the model remembers all previous messages.
await using var session = await client.CreateSessionAsync(new SessionConfig
{
    Model = "gpt-4o",        // Which model to use
    Streaming = true,         // Enable streaming deltas
});
SessionConfig Properties
| Property |
Type |
Description |
Model |
string |
Model ID (e.g., "gpt-4o", "claude-sonnet-4") |
Streaming |
bool |
Enable AssistantMessageDeltaEvent streaming |
Tools |
List<AIFunction> |
Custom tools the model can call |
SystemMessage |
SystemMessageConfig |
Custom system prompt (Append or Replace) |
Hooks |
SessionHooks |
Pre/post tool-use hooks |
OnPermissionRequest |
Func<...> |
Permission handler for write/run operations |
OnUserInputRequest |
Func<...> |
Handler when the model asks the user a question |
InfiniteSessions |
InfiniteSessionConfig |
Enable context compaction for long conversations |
SkillDirectories |
List<string> |
Directories containing SKILL.md files |
DisabledSkills |
List<string> |
Skills to disable by name |
AvailableTools |
List<string> |
Allowlist of built-in tool names |
ExcludedTools |
List<string> |
Denylist of built-in tool names |
McpServers |
Dictionary<string, object> |
MCP server configurations |
CustomAgents |
List<CustomAgentConfig> |
Custom agent configurations |
Sending Messages
| Method |
Behavior |
SendAsync(options) |
Fire-and-forget — returns a message ID immediately. Response arrives via events. |
SendAndWaitAsync(options) |
Blocks until the model finishes (SessionIdleEvent). Returns the final AssistantMessageEvent. |
// Fire-and-forget
var messageId = await session.SendAsync(new MessageOptions { Prompt = "Hello" });

// Blocking
var reply = await session.SendAndWaitAsync(new MessageOptions { Prompt = "Hello" });
Console.WriteLine(reply?.Data.Content);
Event Subscription
Subscribe to all session events using session.On():
var subscription = session.On(evt =>
{
    switch (evt)
    {
        case AssistantMessageDeltaEvent delta:
            Console.Write(delta.Data.DeltaContent);    // streaming token
            break;
        case AssistantMessageEvent message:
            // Complete message
            break;
        case SessionIdleEvent:
            // Model's turn is complete
            break;
        case SessionErrorEvent error:
            Console.WriteLine($"Error: {error.Data?.Message}");
            break;
    }
});

// Later: unsubscribe
subscription.Dispose();
Event Types
| Event |
When |
AssistantMessageDeltaEvent |
Individual streaming token (when Streaming = true) |
AssistantMessageEvent |
Model produces a complete message |
SessionIdleEvent |
Model’s turn is complete |
SessionErrorEvent |
An error occurred during the turn |
SessionResumeEvent |
Session was resumed via ResumeSessionAsync |
SessionCompactionStartEvent |
Context compaction started (infinite sessions) |
SessionCompactionCompleteEvent |
Context compaction finished |
Session Resume
You can reconnect to a previous session to continue the conversation:
// Create and use a session
var session1 = await client.CreateSessionAsync();
var sessionId = session1.SessionId;
await session1.SendAndWaitAsync(new MessageOptions { Prompt = "Remember: 42" });

// Resume later
var session2 = await client.ResumeSessionAsync(sessionId);
var answer = await session2.SendAndWaitAsync(
    new MessageOptions { Prompt = "What number did I mention?" });
// → "42"
System Messages
Configure a system prompt to control model behavior:
// Append mode — adds after the default Copilot system prompt
new SessionConfig
{
    SystemMessage = new SystemMessageConfig
    {
        Mode = SystemMessageMode.Append,
        Content = "Always end responses with 'Have a nice day!'"
    }
}

// Replace mode — completely overrides the system prompt
new SessionConfig
{
    SystemMessage = new SystemMessageConfig
    {
        Mode = SystemMessageMode.Replace,
        Content = "You are an assistant called Testy McTestface. Reply succinctly."
    }
}
| Mode |
Behavior |
Append |
Your content is added after the default Copilot system prompt |
Replace |
Your content completely replaces the default system prompt |
3. Custom Tools — AIFunction
Tools extend the model’s capabilities by letting it call your C# code. The SDK uses Microsoft.Extensions.AI‘s AIFunctionFactory.Create to turn regular methods into callable tools.
How Tools Work
  You (host)                     Copilot Model
  ──────────                     ────────────
  Register tools on session  →   Model sees tool schemas
  Send prompt                →   Model processes prompt
                             ←   Model calls tool (tool_use event)
  SDK executes your C# code
  SDK returns result         →   Model incorporates result
                             ←   Model sends final response
Simple Tool
[Description("Encrypts a string by converting it to uppercase")]
static string EncryptString([Description("String to encrypt")] string input)
    => input.ToUpperInvariant();

var session = await client.CreateSessionAsync(new SessionConfig
{
    Tools = [AIFunctionFactory.Create(EncryptString, "encrypt_string")]
});

var answer = await session.SendAndWaitAsync(
    new MessageOptions { Prompt = "Encrypt: Hello World" });
// Tool is called automatically, response includes "HELLO WORLD"
Key pattern: Use [Description] on the method and on each parameter. Supply (method, name) to AIFunctionFactory.Create.
Multiple Tools on One Session
var session = await client.CreateSessionAsync(new SessionConfig
{
    Tools =
    [
        AIFunctionFactory.Create(GetWeather, "get_weather"),
        AIFunctionFactory.Create(GetTime, "get_time"),
    ]
});

[Description("Gets the current weather for a city")]
static string GetWeather([Description("City name")] string city)
    => $"Weather in {city}: 22°C, partly cloudy";

[Description("Gets the current time for a city")]
static string GetTime([Description("City name")] string city)
    => $"Current time in {city}: {DateTime.UtcNow:HH:mm} UTC";
Complex Input/Output Types
Use C# records for structured input and output. Add a JsonSerializerContext for NativeAOT safety:
record DbQueryOptions(string Table, int[] Ids, bool SortAscending);
record City(int CountryId, string CityName, int Population);

[JsonSourceGenerationOptions(JsonSerializerDefaults.Web)]
[JsonSerializable(typeof(DbQueryOptions))]
[JsonSerializable(typeof(City[]))]
partial class DemoJsonContext : JsonSerializerContext;

City[] PerformDbQuery(DbQueryOptions query, AIFunctionArguments rawArgs)
{
    // Access ToolInvocation metadata
    var invocation = (ToolInvocation)rawArgs.Context![typeof(ToolInvocation)]!;
    // invocation.SessionId, invocation.ToolCallId, etc.
    return [new(1, "Madrid", 3223000)];
}

var tool = AIFunctionFactory.Create(PerformDbQuery, "db_query",
    serializerOptions: DemoJsonContext.Default.Options);
Tool Error Handling
When a tool throws an exception, the SDK catches it and does NOT leak the error message to the model. The model only sees a generic failure:
var failingTool = AIFunctionFactory.Create(
    () => { throw new Exception("Secret error"); },
    "get_location",
    "Gets the user's location");

// Model will NOT see "Secret error" — safe by default
AvailableTools / ExcludedTools Filters
Control which built-in Copilot tools are available in the session:
// Allowlist — only these built-in tools
new SessionConfig { AvailableTools = ["view", "edit"] }

// Denylist — exclude these built-in tools
new SessionConfig { ExcludedTools = ["view"] }
4. Hooks — Pre/Post Tool-Use Interception
Hooks let you intercept tool calls before and after execution:
PreToolUse Hook — Allow or Deny
var session = await client.CreateSessionAsync(new SessionConfig
{
    Tools = [myTool],
    Hooks = new SessionHooks
    {
        OnPreToolUse = (input, invocation) =>
        {
            Console.WriteLine($"Tool: {input.ToolName}, Session: {invocation.SessionId}");
            // Return "allow" or "deny"
            return Task.FromResult<PreToolUseHookOutput?>(
                new PreToolUseHookOutput { PermissionDecision = "allow" });
        }
    }
});
PostToolUse Hook — Inspect Results
Hooks = new SessionHooks
{
    OnPostToolUse = (input, invocation) =>
    {
        var result = input.ToolResult?.ToString();
        Console.WriteLine($"Tool {input.ToolName} returned: {result}");
        return Task.FromResult<PostToolUseHookOutput?>(null);
    }
}
Both Hooks Together
Hooks = new SessionHooks
{
    OnPreToolUse = (input, invocation) =>
    {
        Console.WriteLine($"[PRE]  → {input.ToolName}");
        return Task.FromResult<PreToolUseHookOutput?>(
            new PreToolUseHookOutput { PermissionDecision = "allow" });
    },
    OnPostToolUse = (input, invocation) =>
    {
        Console.WriteLine($"[POST] ← {input.ToolName}");
        return Task.FromResult<PostToolUseHookOutput?>(null);
    }
}
Deny Tool Execution
OnPreToolUse = (input, invocation) =>
{
    return Task.FromResult<PreToolUseHookOutput?>(
        new PreToolUseHookOutput { PermissionDecision = "deny" });
}
// The model will explain it couldn't access the tool
5. Permissions — Write/Run Authorization
Permission handlers control whether the model can perform write operations (file edits, command execution):
var session = await client.CreateSessionAsync(new SessionConfig
{
    OnPermissionRequest = (request, invocation) =>
    {
        Console.WriteLine($"Permission: Kind={request.Kind}, ToolCallId={request.ToolCallId}");
        // Return "approved" or "denied-interactively-by-user"
        return Task.FromResult(new PermissionRequestResult { Kind = "approved" });
    }
});
Permission Result Values
| Kind |
Effect |
"approved" |
Allow the operation |
"denied-interactively-by-user" |
Block the operation |
Key behaviors:
– If no OnPermissionRequest handler is set, the session works normally — permissions are only triggered for write/run operations.
– If the handler throws an exception, the SDK handles it gracefully — permission is denied automatically.
– Permission handlers can be set on ResumeSessionConfig too, so resumed sessions can have different permission policies.
6. User Input Requests — Model Asks the User
The model can ask the user questions via the ask_user built-in tool. You handle these with OnUserInputRequest:
var session = await client.CreateSessionAsync(new SessionConfig
{
    OnUserInputRequest = (request, invocation) =>
    {
        Console.WriteLine($"Question: {request.Question}");

        // Choice-based prompt
        if (request.Choices is { Count: > 0 })
        {
            Console.WriteLine($"Choices: [{string.Join(", ", request.Choices)}]");
            return Task.FromResult(new UserInputResponse
            {
                Answer = request.Choices[0],   // Auto-select first
                WasFreeform = false
            });
        }

        // Freeform input
        return Task.FromResult(new UserInputResponse
        {
            Answer = "My answer",
            WasFreeform = true
        });
    }
});
UserInputRequest Properties
| Property |
Type |
Description |
Question |
string |
The question the model is asking |
Choices |
List<string>? |
Optional choices for the user (if null, freeform input) |
UserInputResponse Properties
| Property |
Type |
Description |
Answer |
string |
The user’s answer |
WasFreeform |
bool |
Whether the answer was typed freely vs. selected from choices |
7. Infinite Sessions & Context Compaction
For long conversations, enable infinite sessions to automatically compact the context when it gets too large:
var session = await client.CreateSessionAsync(new SessionConfig
{
    InfiniteSessions = new InfiniteSessionConfig
    {
        Enabled = true,
        BackgroundCompactionThreshold = 0.005,  // 0.5% → start background compaction
        BufferExhaustionThreshold = 0.01         // 1%   → block and compact
    }
});
Compaction Events
Subscribe to compaction events to monitor when context is being compacted:
session.On(evt =>
{
    if (evt is SessionCompactionStartEvent)
        Console.WriteLine("Compaction started!");
    if (evt is SessionCompactionCompleteEvent c)
        Console.WriteLine($"Compaction done: removed {c.Data.TokensRemoved} tokens, success={c.Data.Success}");
});
Key behavior: The model summarizes earlier messages and removes old tokens. After compaction, the session continues to work — context is preserved via the summary.
8. Skills — SKILL.md Files
Skills shape model behavior by loading instruction files from directories:
SKILL.md Format
---
name: my-skill
description: A skill that adds custom behavior
---

# My Skill Instructions

Always respond in formal English.
Include a table of contents in long answers.
Each skill lives in its own subdirectory with a SKILL.md file:
skills-dir/
  my-skill/
    SKILL.md
  another-skill/
    SKILL.md
Loading Skills
var session = await client.CreateSessionAsync(new SessionConfig
{
    SkillDirectories = ["/path/to/skills-dir"]
});
Disabling Skills
var session = await client.CreateSessionAsync(new SessionConfig
{
    SkillDirectories = ["/path/to/skills-dir"],
    DisabledSkills = ["my-skill"]   // Disable by name from frontmatter
});
9. MCP Servers — Model Context Protocol
Configure MCP servers that provide additional tools to the session:
var session = await client.CreateSessionAsync(new SessionConfig
{
    McpServers = new Dictionary<string, object>
    {
        ["my-server"] = new McpLocalServerConfig
        {
            Type = "local",
            Command = "npx",
            Args = ["-y", "@my-org/mcp-server"],
            Tools = ["*"]   // Expose all tools from this server
        }
    }
});
McpLocalServerConfig Properties
| Property |
Type |
Description |
Type |
string |
Server type — typically "local" |
Command |
string |
Command to start the MCP server |
Args |
List<string> |
Arguments for the command |
Tools |
List<string> |
Which tools to expose (["*"] for all) |
Multiple MCP Servers
McpServers = new Dictionary<string, object>
{
    ["filesystem-server"] = new McpLocalServerConfig { ... },
    ["database-server"] = new McpLocalServerConfig { ... }
}
10. Custom Agents
Configure custom agents with their own prompts, tools, and MCP servers:
var session = await client.CreateSessionAsync(new SessionConfig
{
    CustomAgents = new List<CustomAgentConfig>
    {
        new CustomAgentConfig
        {
            Name = "business-analyst",
            DisplayName = "Business Analyst Agent",
            Description = "Specialized in business analysis",
            Prompt = "You are a business analyst. Focus on data-driven insights.",
            Infer = true   // Model decides when to use this agent
        }
    }
});
CustomAgentConfig Properties
| Property |
Type |
Description |
Name |
string |
Unique agent identifier |
DisplayName |
string |
Human-readable name |
Description |
string |
What the agent does |
Prompt |
string |
System instructions for the agent |
Tools |
List<string>? |
Restricted tool set (e.g., ["bash", "edit"]) |
McpServers |
Dictionary<string, object>? |
Agent-specific MCP servers |
Infer |
bool |
If true, model decides when to invoke the agent |
Agent with Restricted Tools
new CustomAgentConfig
{
    Name = "devops-agent",
    Tools = ["bash", "edit"],   // Only these tools available
    Infer = true
}
Agent with its Own MCP Servers
new CustomAgentConfig
{
    Name = "data-agent",
    McpServers = new Dictionary<string, object>
    {
        ["agent-db"] = new McpLocalServerConfig
        {
            Type = "local",
            Command = "npx",
            Args = ["-y", "@my-org/db-server"],
            Tools = ["*"]
        }
    }
}
Combined MCP + Agents
new SessionConfig
{
    McpServers = new Dictionary<string, object>
    {
        ["shared-server"] = new McpLocalServerConfig { ... }
    },
    CustomAgents = new List<CustomAgentConfig>
    {
        new CustomAgentConfig { Name = "coordinator", ... }
    }
}
MCP & Agents on Session Resume
MCP servers and agents can be added when resuming a session:
var session2 = await client.ResumeSessionAsync(sessionId, new ResumeSessionConfig
{
    McpServers = new Dictionary<string, object>
    {
        ["resume-server"] = new McpLocalServerConfig { ... }
    },
    CustomAgents = new List<CustomAgentConfig>
    {
        new CustomAgentConfig { Name = "resume-agent", ... }
    }
});
The IChatClient Adapter Pattern
The GitHub Copilot SDK uses its own CopilotClient → CopilotSession → events model. To make it compatible with Microsoft.Extensions.AI.IChatClient (which DevExpress DxAIChat, AIChatControl, and other UI components consume), you need an adapter layer.
Architecture
[[[MERMAIDBLOCK1]]]
Step 1 — CopilotOptions
A simple options class bound to appsettings.json:
public sealed class CopilotOptions
{
    public const string SectionName = "Copilot";

    public string Model { get; set; } = "gpt-4o";
    public string? GithubToken { get; set; }
    public string? CliPath { get; set; }
    public bool UseLoggedInUser { get; set; } = true;
    public bool Streaming { get; set; } = true;
}
appsettings.json:
{
  "Copilot": {
    "Model": "gpt-4o",
    "UseLoggedInUser": true
  }
}
Step 2 — CopilotChatService
Wraps CopilotClient with lazy initialization, session creation per request, event-driven response collection, tool wiring, and system message support:
public sealed class CopilotChatService : IAsyncDisposable
{
    private readonly CopilotClient _client;
    private readonly CopilotOptions _options;
    private readonly ILogger<CopilotChatService> _logger;
    private readonly SemaphoreSlim _startLock = new(1, 1);
    private bool _started;

    /// <summary>Runtime-changeable model selection.</summary>
    public string CurrentModel
    {
        get => _options.Model;
        set => _options.Model = value;
    }

    /// <summary>Custom tools exposed to the Copilot SDK.</summary>
    public IReadOnlyList<AIFunction>? Tools { get; set; }

    /// <summary>Optional system message appended to the session.</summary>
    public string? SystemMessage { get; set; }

    public CopilotChatService(
        IOptions<CopilotOptions> optionsAccessor,
        ILogger<CopilotChatService> logger)
    {
        _options = optionsAccessor?.Value ?? new CopilotOptions();
        _logger = logger;
        _client = new CopilotClient(new CopilotClientOptions
        {
            CliPath = string.IsNullOrWhiteSpace(_options.CliPath) ? null : _options.CliPath,
            GithubToken = string.IsNullOrWhiteSpace(_options.GithubToken) ? null : _options.GithubToken,
            UseLoggedInUser = string.IsNullOrWhiteSpace(_options.GithubToken)
                              && _options.UseLoggedInUser,
            Logger = logger
        });
    }

    private async Task EnsureStartedAsync()
    {
        if (_started) return;
        await _startLock.WaitAsync().ConfigureAwait(false);
        try
        {
            if (_started) return;
            await _client.StartAsync().ConfigureAwait(false);
            _started = true;
        }
        finally { _startLock.Release(); }
    }

    public async Task<string> AskAsync(
        string prompt, CancellationToken cancellationToken = default)
    {
        ArgumentException.ThrowIfNullOrWhiteSpace(prompt);
        await EnsureStartedAsync().ConfigureAwait(false);

        // ── Build session config ──────────────────────────────
        var config = new SessionConfig
        {
            Model = _options.Model,
            Streaming = true,
        };
        if (Tools is { Count: > 0 })
            config.Tools = Tools.ToList();
        if (!string.IsNullOrWhiteSpace(SystemMessage))
            config.SystemMessage = new SystemMessageConfig
            {
                Mode = SystemMessageMode.Append,
                Content = SystemMessage
            };

        // ── Create session, send, collect via events ──────────
        await using var session = await _client
            .CreateSessionAsync(config).ConfigureAwait(false);

        var buffer = new StringBuilder();
        string? lastError = null;
        var idleTcs = new TaskCompletionSource<bool>(
            TaskCreationOptions.RunContinuationsAsynchronously);

        var subscription = session.On(evt =>
        {
            switch (evt)
            {
                case AssistantMessageDeltaEvent delta:
                    buffer.Append(delta.Data.DeltaContent);
                    break;
                case SessionErrorEvent error:
                    lastError = error.Data?.Message ?? "Unknown session error";
                    _logger.LogError("[SessionError] {Message}", lastError);
                    idleTcs.TrySetResult(false);
                    break;
                case SessionIdleEvent:
                    idleTcs.TrySetResult(true);
                    break;
            }
        });

        try
        {
            using var cts = CancellationTokenSource
                .CreateLinkedTokenSource(cancellationToken);
            cts.CancelAfter(TimeSpan.FromMinutes(2));

            try
            {
                await session.SendAsync(new MessageOptions { Prompt = prompt })
                    .WaitAsync(cts.Token).ConfigureAwait(false);
                await idleTcs.Task.WaitAsync(cts.Token).ConfigureAwait(false);
            }
            catch (OperationCanceledException)
                when (!cancellationToken.IsCancellationRequested)
            {
                _logger.LogWarning("[AskAsync] Timed out. Buffer: {Len}", buffer.Length);
            }

            if (buffer.Length > 0)
                return buffer.ToString();
            if (lastError != null)
                return $"Error: {lastError}";
            return "No response received from the AI model. Please try again.";
        }
        finally { subscription.Dispose(); }
    }

    /// <summary>
    /// Streams response deltas. In SDK v0.1.x, true delta streaming
    /// through session events is unreliable when tool calls are involved,
    /// so this yields the complete response as a single chunk.
    /// </summary>
    public async IAsyncEnumerable<string> AskStreamingAsync(
        string prompt,
        [EnumeratorCancellation] CancellationToken cancellationToken = default)
    {
        var response = await AskAsync(prompt, cancellationToken)
            .ConfigureAwait(false);
        if (!string.IsNullOrEmpty(response))
            yield return response;
    }

    public async ValueTask DisposeAsync()
    {
        if (_started)
        {
            try { await _client.StopAsync().ConfigureAwait(false); }
            catch (Exception ex)
            {
                _logger.LogWarning(ex, "Failed to stop Copilot client cleanly.");
            }
        }
        await _client.DisposeAsync().ConfigureAwait(false);
        _startLock.Dispose();
    }
}
Key design decisions:
- Lazy start:
EnsureStartedAsync() uses a SemaphoreSlim to start the client on first use.
- Session-per-request: Each
AskAsync call creates a new session. This is stateless from the consumer’s perspective (the IChatClient contract is stateless).
- Event-driven collection: Uses
session.On() to accumulate AssistantMessageDeltaEvent tokens into a StringBuilder, then waits for SessionIdleEvent.
- 2-minute timeout: Prevents hanging on unresponsive models.
Step 3 — CopilotChatClient (IChatClient Adapter)
Wraps CopilotChatService as an IChatClient so any consumer (DevExpress DxAIChat, AIChatControl, etc.) can use it via DI:
public sealed class CopilotChatClient : IChatClient
{
    private readonly CopilotChatService _service;

    public CopilotChatClient(CopilotChatService service)
    {
        _service = service ?? throw new ArgumentNullException(nameof(service));
    }

    public ChatClientMetadata Metadata => new("CopilotChat");

    public async Task<ChatResponse> GetResponseAsync(
        IEnumerable<ChatMessage> chatMessages,
        ChatOptions? options = null,
        CancellationToken cancellationToken = default)
    {
        // Extract the last user message as the prompt
        var lastUserMessage = chatMessages
            .LastOrDefault(m => m.Role == ChatRole.User);
        var prompt = lastUserMessage?.Text ?? string.Empty;

        var response = await _service.AskAsync(prompt, cancellationToken);
        return new ChatResponse(new ChatMessage(ChatRole.Assistant, response));
    }

    public async IAsyncEnumerable<ChatResponseUpdate> GetStreamingResponseAsync(
        IEnumerable<ChatMessage> chatMessages,
        ChatOptions? options = null,
        [EnumeratorCancellation] CancellationToken cancellationToken = default)
    {
        var lastUserMessage = chatMessages
            .LastOrDefault(m => m.Role == ChatRole.User);
        var prompt = lastUserMessage?.Text ?? string.Empty;

        await foreach (var chunk in _service
            .AskStreamingAsync(prompt, cancellationToken)
            .ConfigureAwait(false))
        {
            yield return new ChatResponseUpdate
            {
                Role = ChatRole.Assistant,
                Contents = [new TextContent(chunk)]
            };
        }
    }

    public object? GetService(Type serviceType, object? serviceKey = null)
        => serviceType == typeof(CopilotChatClient) ? this : null;

    public void Dispose() { }
}
Key pattern: The adapter extracts the last user message’s text as the prompt, delegates to CopilotChatService, and wraps the result in ChatResponse / ChatResponseUpdate objects.
Step 4 — Tools Provider
Encapsulates AIFunction creation. The tools are created lazily and shared across requests:
public sealed class MyToolsProvider
{
    private readonly IServiceProvider _serviceProvider;
    private List<AIFunction>? _tools;

    public MyToolsProvider(IServiceProvider serviceProvider)
    {
        _serviceProvider = serviceProvider;
    }

    public IReadOnlyList<AIFunction> Tools => _tools ??= CreateTools();

    private List<AIFunction> CreateTools() =>
    [
        AIFunctionFactory.Create(GetWeather, "get_weather"),
        AIFunctionFactory.Create(GetTime, "get_time"),
        AIFunctionFactory.Create(QueryDatabase, "query_database"),
    ];

    [Description("Gets the current weather for a city")]
    private string GetWeather(
        [Description("City name")] string city)
        => $"Weather in {city}: 22°C, partly cloudy";

    [Description("Gets the current time for a city")]
    private string GetTime(
        [Description("City name")] string city)
        => $"Current time in {city}: {DateTime.UtcNow:HH:mm} UTC";

    [Description("Queries the database for records")]
    private string QueryDatabase(
        [Description("Table name")] string table,
        [Description("Search term")] string search = "")
    {
        // Use DI to get a DbContext, IObjectSpace, etc.
        using var scope = _serviceProvider.CreateScope();
        var db = scope.ServiceProvider.GetRequiredService<MyDbContext>();
        // ... query and return results as string
        return "Query results...";
    }
}
Key pattern for database access: Create a DI scope inside each tool method, resolve the database context, query, and return a plain string. The SDK serializes the return value automatically.
Step 5 — DI Registration (AddCopilotSdk Extension)
Wire everything together with a single extension method:
public static class ServiceCollectionExtensions
{
    public static IServiceCollection AddCopilotSdk(
        this IServiceCollection services,
        IConfiguration configuration)
    {
        ArgumentNullException.ThrowIfNull(services);
        ArgumentNullException.ThrowIfNull(configuration);

        // 1. Bind options from appsettings.json
        services.Configure<CopilotOptions>(
            configuration.GetSection(CopilotOptions.SectionName));

        // 2. Register the service (singleton — manages CopilotClient lifecycle)
        services.AddSingleton<CopilotChatService>();

        // 3. Register the tools provider
        services.AddSingleton<MyToolsProvider>();

        // 4. Register the IChatClient adapter
        services.AddChatClient(sp =>
        {
            var service = sp.GetRequiredService<CopilotChatService>();
            var toolsProvider = sp.GetRequiredService<MyToolsProvider>();

            // Wire tools and system message into the service
            service.Tools = toolsProvider.Tools;
            service.SystemMessage = "You are a helpful assistant.";

            return new CopilotChatClient(service);
        });

        return services;
    }
}
Step 6 — Usage in Program.cs
var builder = WebApplication.CreateBuilder(args);

// Register all Copilot SDK services + IChatClient
builder.Services.AddCopilotSdk(builder.Configuration);

// ... rest of your app setup
var app = builder.Build();
app.Run();
Now any component that depends on IChatClient will automatically use the GitHub Copilot SDK as its backend.
Markdown Rendering (Optional)
If your chat UI renders Markdown responses as HTML, use Markdig + HtmlSanitizer:
public static class CopilotChatDefaults
{
    private static readonly MarkdownPipeline Pipeline = new MarkdownPipelineBuilder()
        .UsePipeTables()
        .UseEmphasisExtras()
        .UseAutoLinks()
        .UseTaskLists()
        .Build();

    private static readonly HtmlSanitizer Sanitizer = CreateSanitizer();

    private static HtmlSanitizer CreateSanitizer()
    {
        var sanitizer = new HtmlSanitizer();
        foreach (var tag in new[] { "table", "thead", "tbody", "tr", "th", "td" })
            sanitizer.AllowedTags.Add(tag);
        return sanitizer;
    }

    /// <summary>
    /// Converts Markdown to sanitized HTML. Thread-safe.
    /// </summary>
    public static string ConvertMarkdownToHtml(string markdown)
    {
        if (string.IsNullOrEmpty(markdown))
            return string.Empty;

        var html = Markdown.ToHtml(markdown, Pipeline);
        return Sanitizer.Sanitize(html);
    }
}
Packages required:
dotnet add package Markdig --version "0.38.*"
dotnet add package HtmlSanitizer --version "8.*"
UI Defaults — Header, Empty State, Prompt Suggestions
Centralize your chat UI configuration in a static class so both Blazor and WinForms can share it:
public static class CopilotChatDefaults
{
    public const string HeaderText = "Copilot Assistant";

    public const string EmptyStateText =
        "Ask me anything about your data.\nPowered by GitHub Copilot SDK.";

    public record PromptSuggestionItem(string Title, string Text, string Prompt);

    public static IReadOnlyList<PromptSuggestionItem> PromptSuggestions { get; } =
    [
        new("Weather", "Check the weather", "What's the weather in Madrid?"),
        new("Time", "Check the time", "What time is it in Tokyo?"),
        new("Help", "What can you do?", "What tools do you have available?"),
    ];

    public const string SystemPrompt = """
        You are a helpful assistant.
        When answering:
        - Use Markdown formatting.
        - Be concise but thorough.
        """;

    // ... ConvertMarkdownToHtml (see above)
}
Streaming Pattern — Interactive Console Chat
Build an interactive chat loop using SendAsync + event subscription for real-time streaming:
var client = new CopilotClient(new CopilotClientOptions
{
    UseLoggedInUser = true,
    Logger = logger
});
await client.StartAsync();

await using var session = await client.CreateSessionAsync(new SessionConfig
{
    Streaming = true,
    Tools =
    [
        AIFunctionFactory.Create(GetWeather, "get_weather"),
        AIFunctionFactory.Create(GetTime, "get_time"),
    ]
});

Console.WriteLine("Type messages (empty to quit):\n");
while (true)
{
    Console.Write("You: ");
    var input = Console.ReadLine();
    if (string.IsNullOrWhiteSpace(input)) break;

    var done = new TaskCompletionSource<bool>();
    var sub = session.On(evt =>
    {
        if (evt is AssistantMessageDeltaEvent d)
            Console.Write(d.Data.DeltaContent);
        if (evt is SessionIdleEvent)
            done.TrySetResult(true);
        if (evt is SessionErrorEvent err)
        {
            Console.WriteLine($"\nError: {err.Data?.Message}");
            done.TrySetResult(false);
        }
    });

    Console.Write("AI: ");
    await session.SendAsync(new MessageOptions { Prompt = input });
    await done.Task.WaitAsync(TimeSpan.FromMinutes(2));
    Console.WriteLine();
    sub.Dispose();
}

await client.StopAsync();
await client.DisposeAsync();
Blazor Integration Example
A complete Blazor Server app using the IChatClient adapter with DevExpress DxAIChat:
Program.cs
using MyApp.Services;
using Microsoft.EntityFrameworkCore;

var builder = WebApplication.CreateBuilder(args);

// EF Core (optional — for tool database access)
builder.Services.AddDbContextFactory<MyDbContext>(options =>
    options.UseSqlite("Data Source=app.db"));

// GitHub Copilot SDK → IChatClient
builder.Services.AddCopilotSdk(builder.Configuration);

// DevExpress AI integration (registers DxAIChat component)
builder.Services.AddDevExpressAI();

// Blazor
builder.Services.AddRazorComponents()
    .AddInteractiveServerComponents();

var app = builder.Build();

app.UseHttpsRedirection();
app.UseStaticFiles();
app.UseAntiforgery();
app.MapRazorComponents<App>()
    .AddInteractiveServerRenderMode();

app.Run();
Chat.razor (using DxAIChat)
@using DevExpress.AIIntegration.Blazor.Chat
@using MyApp.Services

<DxAIChat CssClass="copilot-chat"
          Streaming="true"
          RenderMode="MarkupContentRenderMode.Sanitized"
          MessageContentConverting="OnMessageContentConverting"
          ResponseContentType="ResponseContentType.Markdown">
    <EmptyStateContentTemplate>
        <div class="chat-empty-state">
            <h3>@CopilotChatDefaults.HeaderText</h3>
            <p>@CopilotChatDefaults.EmptyStateText</p>
        </div>
    </EmptyStateContentTemplate>
    <MessageContentTemplate>
        <div class="chat-message">@((MarkupString)context.Content)</div>
    </MessageContentTemplate>
</DxAIChat>

@code {
    private void OnMessageContentConverting(MessageContentConvertingEventArgs e)
    {
        if (e.Role == ChatRole.Assistant)
        {
            e.Content = CopilotChatDefaults.ConvertMarkdownToHtml(e.Content);
        }
    }
}
The DxAIChat component resolves IChatClient from DI automatically — no explicit wiring required.
Configuration Reference
appsettings.json
{
  "Copilot": {
    "Model": "gpt-4o",
    "UseLoggedInUser": true,
    "Streaming": true
  }
}
CopilotOptions Properties
| Property |
Type |
Default |
Description |
Model |
string |
"gpt-4o" |
The model to use for new sessions |
GithubToken |
string? |
null |
GitHub PAT. Overrides UseLoggedInUser |
CliPath |
string? |
null |
Custom path to the Copilot CLI binary |
UseLoggedInUser |
bool |
true |
Use VS Code / gh CLI authentication |
Streaming |
bool |
true |
Enable streaming deltas |
Runtime Model Switching
var service = serviceProvider.GetRequiredService<CopilotChatService>();
service.CurrentModel = "claude-sonnet-4";
// Next AskAsync call will use Claude
Troubleshooting
1. “Error: Not authenticated”
Cause: The Copilot CLI cannot find valid GitHub credentials.
Fix:
– Log in via VS Code (GitHub extension) or run gh auth login in your terminal.
– Or set GithubToken in CopilotOptions / appsettings.json.
2. The client hangs on StartAsync()
Cause: The Copilot CLI binary is not found or not in PATH.
Fix:
– Ensure GitHub Copilot CLI is installed. Check with which github-copilot-cli or where github-copilot-cli.
– Or set CliPath in CopilotOptions to the full path.
– Try ForceStopAsync() if StopAsync() hangs.
3. Tool calls are not returned in streaming
Cause: In SDK v0.1.x, true delta streaming through session events is unreliable when tool calls are involved.
Fix: The AskStreamingAsync method in CopilotChatService uses AskAsync under the hood and yields the complete response as a single chunk. This guarantees tool-call results are included.
4. IOException when using a disposed session
Cause: You called a method on a session after DisposeAsync().
Fix: Use await using to ensure proper scope, or check session state before calling methods.
5. Permission handler exceptions
Cause: Your OnPermissionRequest handler threw an exception.
Behavior: The SDK handles the exception gracefully — permission is denied automatically. The session continues to work.
6. “No response received from the AI model”
Cause: The 2-minute timeout elapsed before the model responded, or there was a network issue.
Fix:
– Increase the timeout in AskAsync if needed.
– Check your network connection.
– Verify the model is available via ListModelsAsync().
7. NativeAOT serialization errors with complex tool types
Cause: Using records/arrays as tool input/output without a JsonSerializerContext.
Fix: Create a JsonSerializerContext and pass it to AIFunctionFactory.Create:
[JsonSourceGenerationOptions(JsonSerializerDefaults.Web)]
[JsonSerializable(typeof(MyInputType))]
[JsonSerializable(typeof(MyOutputType))]
partial class MyJsonContext : JsonSerializerContext;

var tool = AIFunctionFactory.Create(MyMethod, "my_tool",
    serializerOptions: MyJsonContext.Default.Options);
API Quick Reference
CopilotClient
| Method |
Returns |
Description |
StartAsync() |
Task |
Start the Copilot process |
StopAsync() |
Task |
Graceful shutdown |
ForceStopAsync() |
Task |
Hard kill |
DisposeAsync() |
ValueTask |
Release resources |
PingAsync(msg) |
PongResponse |
Verify connection |
GetStatusAsync() |
StatusResponse |
Version info |
GetAuthStatusAsync() |
AuthStatusResponse |
Auth status |
ListModelsAsync() |
IList<Model> |
Available models |
CreateSessionAsync(config) |
CopilotSession |
Create a session |
ResumeSessionAsync(id, config?) |
CopilotSession |
Resume a session |
CopilotSession
| Method |
Returns |
Description |
SendAsync(options) |
string |
Fire-and-forget send |
SendAndWaitAsync(options) |
AssistantMessageEvent? |
Blocking send |
On(handler) |
IDisposable |
Subscribe to events |
GetMessagesAsync() |
IList<SessionEvent> |
Get message history |
AbortAsync() |
Task |
Abort current turn |
DisposeAsync() |
ValueTask |
Destroy session |
SessionConfig
| Property |
Type |
Description |
Model |
string |
Model ID |
Streaming |
bool |
Enable streaming |
Tools |
List<AIFunction> |
Custom tools |
SystemMessage |
SystemMessageConfig |
System prompt |
Hooks |
SessionHooks |
Pre/post tool hooks |
OnPermissionRequest |
Func<...> |
Permission handler |
OnUserInputRequest |
Func<...> |
User input handler |
InfiniteSessions |
InfiniteSessionConfig |
Compaction config |
SkillDirectories |
List<string> |
Skill directories |
DisabledSkills |
List<string> |
Disabled skills |
AvailableTools |
List<string> |
Built-in tool allowlist |
ExcludedTools |
List<string> |
Built-in tool denylist |
McpServers |
Dictionary<string, object> |
MCP servers |
CustomAgents |
List<CustomAgentConfig> |
Custom agents |
IChatClient Adapter (CopilotChatClient)
| Method |
Returns |
Description |
GetResponseAsync(messages, options?, ct) |
ChatResponse |
Non-streaming response |
GetStreamingResponseAsync(messages, options?, ct) |
IAsyncEnumerable<ChatResponseUpdate> |
Streaming response |
GetService(type, key?) |
object? |
Service resolution |
Dispose() |
void |
No-op (lifecycle managed by DI) |
Complete Minimal Example — Console App with Tools and IChatClient
A standalone console app that demonstrates the full stack: CopilotClient → CopilotChatService → CopilotChatClient (IChatClient) → consumer.
Program.cs
using Microsoft.Extensions.AI;
using Microsoft.Extensions.DependencyInjection;
using Microsoft.Extensions.Logging;
using Microsoft.Extensions.Options;
using System.ComponentModel;
using System.Runtime.CompilerServices;
using System.Text;
using GitHub.Copilot.SDK;

// ── DI Setup ──────────────────────────────────────────────────────────
var services = new ServiceCollection();
services.AddLogging(b => b.AddConsole().SetMinimumLevel(LogLevel.Warning));

// Configure options manually (no appsettings.json in console)
services.Configure<CopilotOptions>(o =>
{
    o.Model = "gpt-4o";
    o.UseLoggedInUser = true;
});

services.AddSingleton<CopilotChatService>();

// Register IChatClient via the adapter
services.AddSingleton<IChatClient>(sp =>
{
    var svc = sp.GetRequiredService<CopilotChatService>();

    // Wire tools
    svc.Tools =
    [
        AIFunctionFactory.Create(GetWeather, "get_weather"),
        AIFunctionFactory.Create(GetTime, "get_time"),
    ];
    svc.SystemMessage = "You are a helpful assistant. Use Markdown formatting.";

    return new CopilotChatClient(svc);
});

var provider = services.BuildServiceProvider();

// ── Use IChatClient ───────────────────────────────────────────────────
var chatClient = provider.GetRequiredService<IChatClient>();

var messages = new List<ChatMessage>
{
    new(ChatRole.User, "What's the weather in Tokyo and what time is it?")
};

var response = await chatClient.GetResponseAsync(messages);
Console.WriteLine($"Response: {response.Message.Text}");

// ── Cleanup ───────────────────────────────────────────────────────────
await provider.DisposeAsync();

// ── Tool implementations ──────────────────────────────────────────────
[Description("Gets the current weather for a city")]
static string GetWeather([Description("City name")] string city)
    => $"Weather in {city}: 22°C, partly cloudy, humidity 65%";

[Description("Gets the current time for a city")]
static string GetTime([Description("City name")] string city)
    => $"Current time in {city}: {DateTime.UtcNow:HH:mm} UTC";

// ── Supporting classes (normally in separate files) ────────────────────

public sealed class CopilotOptions
{
    public const string SectionName = "Copilot";
    public string Model { get; set; } = "gpt-4o";
    public string? GithubToken { get; set; }
    public string? CliPath { get; set; }
    public bool UseLoggedInUser { get; set; } = true;
    public bool Streaming { get; set; } = true;
}

public sealed class CopilotChatService : IAsyncDisposable
{
    private readonly CopilotClient _client;
    private readonly CopilotOptions _options;
    private readonly ILogger<CopilotChatService> _logger;
    private readonly SemaphoreSlim _startLock = new(1, 1);
    private bool _started;

    public string CurrentModel { get => _options.Model; set => _options.Model = value; }
    public IReadOnlyList<AIFunction>? Tools { get; set; }
    public string? SystemMessage { get; set; }

    public CopilotChatService(IOptions<CopilotOptions> opts, ILogger<CopilotChatService> logger)
    {
        _options = opts?.Value ?? new CopilotOptions();
        _logger = logger;
        _client = new CopilotClient(new CopilotClientOptions
        {
            CliPath = string.IsNullOrWhiteSpace(_options.CliPath) ? null : _options.CliPath,
            GithubToken = string.IsNullOrWhiteSpace(_options.GithubToken) ? null : _options.GithubToken,
            UseLoggedInUser = string.IsNullOrWhiteSpace(_options.GithubToken) && _options.UseLoggedInUser,
            Logger = logger
        });
    }

    private async Task EnsureStartedAsync()
    {
        if (_started) return;
        await _startLock.WaitAsync();
        try { if (!_started) { await _client.StartAsync(); _started = true; } }
        finally { _startLock.Release(); }
    }

    public async Task<string> AskAsync(string prompt, CancellationToken ct = default)
    {
        await EnsureStartedAsync();
        var config = new SessionConfig { Model = _options.Model, Streaming = true };
        if (Tools is { Count: > 0 }) config.Tools = Tools.ToList();
        if (!string.IsNullOrWhiteSpace(SystemMessage))
            config.SystemMessage = new SystemMessageConfig
            { Mode = SystemMessageMode.Append, Content = SystemMessage };

        await using var session = await _client.CreateSessionAsync(config);
        var buf = new StringBuilder();
        string? err = null;
        var idle = new TaskCompletionSource<bool>(TaskCreationOptions.RunContinuationsAsynchronously);
        var sub = session.On(e =>
        {
            if (e is AssistantMessageDeltaEvent d) buf.Append(d.Data.DeltaContent);
            if (e is SessionErrorEvent se) { err = se.Data?.Message; idle.TrySetResult(false); }
            if (e is SessionIdleEvent) idle.TrySetResult(true);
        });
        try
        {
            using var cts = CancellationTokenSource.CreateLinkedTokenSource(ct);
            cts.CancelAfter(TimeSpan.FromMinutes(2));
            await session.SendAsync(new MessageOptions { Prompt = prompt }).WaitAsync(cts.Token);
            await idle.Task.WaitAsync(cts.Token);
        }
        catch (OperationCanceledException) when (!ct.IsCancellationRequested) { }
        finally { sub.Dispose(); }
        return buf.Length > 0 ? buf.ToString() : err ?? "No response.";
    }

    public async IAsyncEnumerable<string> AskStreamingAsync(
        string prompt, [EnumeratorCancellation] CancellationToken ct = default)
    {
        var r = await AskAsync(prompt, ct);
        if (!string.IsNullOrEmpty(r)) yield return r;
    }

    public async ValueTask DisposeAsync()
    {
        if (_started) try { await _client.StopAsync(); } catch { }
        await _client.DisposeAsync();
        _startLock.Dispose();
    }
}

public sealed class CopilotChatClient : IChatClient
{
    private readonly CopilotChatService _svc;
    public CopilotChatClient(CopilotChatService svc) => _svc = svc;
    public ChatClientMetadata Metadata => new("CopilotChat");

    public async Task<ChatResponse> GetResponseAsync(
        IEnumerable<ChatMessage> msgs, ChatOptions? opt = null, CancellationToken ct = default)
    {
        var prompt = msgs.LastOrDefault(m => m.Role == ChatRole.User)?.Text ?? "";
        var resp = await _svc.AskAsync(prompt, ct);
        return new ChatResponse(new ChatMessage(ChatRole.Assistant, resp));
    }

    public async IAsyncEnumerable<ChatResponseUpdate> GetStreamingResponseAsync(
        IEnumerable<ChatMessage> msgs, ChatOptions? opt = null,
        [EnumeratorCancellation] CancellationToken ct = default)
    {
        var prompt = msgs.LastOrDefault(m => m.Role == ChatRole.User)?.Text ?? "";
        await foreach (var c in _svc.AskStreamingAsync(prompt, ct))
            yield return new ChatResponseUpdate
            { Role = ChatRole.Assistant, Contents = [new TextContent(c)] };
    }

    public object? GetService(Type t, object? k = null) => t == typeof(CopilotChatClient) ? this : null;
    public void Dispose() { }
}
File Layout Summary
For a clean separation into reusable files:
MyProject/
├── Program.cs                         ← Host setup + DI
├── appsettings.json                   ← Copilot configuration
├── MyProject.csproj                   ← Package references
└── Services/
    ├── CopilotOptions.cs              ← Options POCO
    ├── CopilotChatService.cs          ← CopilotClient lifecycle + AskAsync
    ├── CopilotChatClient.cs           ← IChatClient adapter
    ├── CopilotChatDefaults.cs         ← UI defaults + Markdown rendering
    ├── MyToolsProvider.cs             ← AIFunction tool factory
    └── ServiceCollectionExtensions.cs ← AddCopilotSdk() extension
Checklist — Common Failures
| # |
Symptom |
Fix |
| 1 |
Not authenticated |
Log in via gh auth login or set GithubToken |
| 2 |
StartAsync hangs |
Copilot CLI not found — set CliPath or install CLI |
| 3 |
Tool results missing from streamed response |
Use AskAsync (collects full response including tool-call results) |
| 4 |
IOException on disposed session |
Use await using for session scope |
| 5 |
Permission denied unexpectedly |
Check OnPermissionRequest handler — exceptions cause auto-deny |
| 6 |
Skill not applied (marker missing) |
Verify SKILL.md path in SkillDirectories and skill name in frontmatter |
| 7 |
IChatClient not resolved from DI |
Ensure AddChatClient() is called in AddCopilotSdk() |
| 8 |
Model not available |
Call ListModelsAsync() to verify — model IDs are case-sensitive |
References
by Joche Ojeda | Feb 16, 2026 | A.I, Apps, CLI, Github Copilot, SDK
A strange week
This week I was going to the university every day to study Russian.
Learning a new language as an adult is a very humbling experience. One moment you are designing enterprise architectures, and the next moment you are struggling to say:
me siento bien
which in Russian is: я чувствую себя хорошо
So like any developer, I started cheating immediately.
I began using AI for everything:
- ChatGPT to review my exercises
- GitHub Copilot inside VS Code correcting my grammar
- Sometimes both at the same time
It worked surprisingly well. Almost too well.
At some point during the week, while going back and forth between my Russian homework and my development work, I noticed something interesting.
I was using several AI tools, but the one I kept returning to the most — without even thinking about it — was GitHub Copilot inside Visual Studio Code.
Not in the browser. Not in a separate chat window. Right there in my editor.
That’s when something clicked.
Two favorite tools
XAF is my favorite application framework. I’ve built countless systems with it — ERPs, internal tools, experiments, prototypes.
GitHub Copilot has become my favorite AI agent.
I use it constantly:
- writing code
- reviewing ideas
- fixing small mistakes
- even correcting my Russian exercises
And while using Copilot so much inside Visual Studio Code, I started thinking:
What would it feel like to have Copilot inside my own applications?
Not next to them. Inside them.
That idea stayed in my head for a few days until curiosity won.
The innocent experiment
I discovered the GitHub Copilot SDK.
At first glance it looked simple: a .NET library that allows you to embed Copilot into your own applications.
My first thought:
“Nice. This should take 30 minutes.”
Developers should always be suspicious of that sentence.
Because it never takes 30 minutes.
First success (false confidence)
The initial integration was surprisingly easy.
I managed to get a basic response from Copilot inside a test environment. Seeing AI respond from inside my own application felt a bit surreal.
For a moment I thought:
Done. Easy win.
Then I tried to make it actually useful.
That’s when the adventure began.
The rabbit hole
I didn’t want just a chatbot.
I wanted an agent that could actually interact with the application.
Ask questions. Query data. Help create things.
That meant enabling tool calling and proper session handling.
And suddenly everything started failing.
Timeouts. Half responses. Random behavior depending on the model. Sessions hanging for no clear reason.
At first I blamed myself.
Then my integration. Then threading. Then configuration.
Three or four hours later, after trying everything I could think of, I finally discovered the real issue:
It wasn’t my code.
It was the model.
Some models were timing out during tool calls. Others worked perfectly.
The moment I switched models and everything suddenly worked was one of those small but deeply satisfying developer victories.
You know the moment.
You sit back. Look at the screen. And just smile.
The moment it worked
Once everything was connected properly, something changed.
Copilot stopped feeling like a coding assistant and started feeling like an agent living inside the application.
Not in the IDE. Not in a browser tab. Inside the system itself.
That changes the perspective completely.
Instead of building forms and navigation flows, you start thinking:
What if the user could just ask?
Instead of:
- open this screen
- filter this grid
- generate this report
You imagine:
- “Show me what matters.”
- “Create what I need.”
- “Explain this data.”
The interface becomes conversational.
And once you see that working inside your own application, it’s very hard to unsee it.
Why this experiment mattered to me
This wasn’t about building a feature for a client. It wasn’t even about shipping production code.
Most of my work is research and development. Prototypes. Ideas. Experiments.
And this experiment changed the way I see enterprise applications.
For decades we optimized screens, menus, and workflows.
But AI introduces a completely different interaction model.
One where the application is no longer just something you navigate.
It’s something you talk to.
Also… Russian homework
Ironically, this whole experiment started because I was trying to survive my Russian classes.
Using Copilot to correct grammar. Using AI to review exercises. Switching constantly between tools.
Eventually that daily workflow made me curious:
What happens if Copilot is not next to my application, but inside it?
Sometimes innovation doesn’t start with a big strategy.
Sometimes it starts with curiosity and a small personal frustration.
What comes next
This is just the beginning.
Now that AI can live inside applications:
- conversations can become interfaces
- tools can be invoked by language
- workflows can become more flexible
We are moving from:
software you operate
to:
software you collaborate with
And honestly, that’s a very exciting direction.
Final thought
This entire journey started with a simple curiosity while studying Russian and writing code in the same week.
A few hours of experimentation later, Copilot was living inside my favorite framework.
And now I can’t imagine going back.
Note: The next article will go deep into the technical implementation — the architecture, the service layer, tool calling, and how I wired everything into XAF for both Blazor and WinForms.

by Joche Ojeda | Feb 11, 2026 | A.I
My last two articles have been about one idea: closing the loop with AI.
Not “AI-assisted coding.” Not “AI that helps you write functions.”
I’m talking about something else entirely.
I’m talking about building systems where the agent writes the code, tests the code, evaluates the result,
fixes the code, and repeats — without me sitting in the middle acting like a tired QA engineer.
Because honestly, that middle position is the worst place to be.
You get exhausted. You lose objectivity. And eventually you look at the project and think:
everything here is garbage.
So the goal is simple:
Remove the human from the middle of the loop.
Place the human at the end of the loop.
The human should only confirm: “Is this what I asked for?”
Not manually test every button.
The Real Question: How Do You Close the Loop?
There isn’t a single answer. It depends on the technology stack and the type of application you’re building.
So far, I’ve been experimenting with three environments:
- Console applications
- Web applications
- Windows Forms applications (still a work in progress)
Each one requires a slightly different strategy.
But the core principle is always the same:
The agent must be able to observe what it did.
If the agent cannot see logs, outputs, state, or results — the loop stays open.
Console Applications: The Easiest Loop to Close
Console apps are the simplest place to start.
My setup is minimal and extremely effective:
- Serilog writing structured logs
- Logs written to the file system
- Output written to the console
Why both?
Because the agent (GitHub Copilot in VS Code) can run the app, read console output, inspect log files,
decide what to fix, and repeat.
No UI. No browser. No complex state.
Just input → execution → output → evaluation.
If you want to experiment with autonomous loops, start here. Console apps are the cleanest lab environment you’ll ever get.
Web Applications: Where Things Get Interesting
Web apps are more complex, but also more powerful.
My current toolset:
- Serilog for structured logging
- Logs written to filesystem
- SQLite for loop-friendly database inspection
- Playwright for automated UI testing
Even if production uses PostgreSQL or SQL Server, I use SQLite during loop testing.
Not for production. For iteration.
The SQLite CLI makes inspection trivial.
The agent can call the API, trigger workflows, query SQLite directly, verify results, and continue fixing.
That’s a full feedback loop. No human required.
Playwright: Giving the Agent Eyes
For UI testing, Playwright is the key.
You can run it headless (fully autonomous) or with UI visible (my preferred mode).
Yes, I could remove myself completely. But I don’t.
Right now I sit outside the loop as an observer.
Not a tester. Not a debugger. Just watching.
If something goes completely off the rails, I interrupt.
Otherwise, I let the loop run.
This is an important transition:
From participant → to observer.
The Windows Forms Problem
Now comes the tricky part: Windows Forms.
Console apps are easy. Web apps have Playwright.
But desktop UI automation is messy.
Possible directions I’m exploring:
- UI Automation APIs
- WinAppDriver
- Logging + state inspection hybrid approach
- Screenshot-based verification
- Accessibility tree inspection
The goal remains the same: the agent must be able to verify what happened without me.
Once that happens, the loop closes.
What I’ve Learned So Far
1) Logs Are Everything
If the agent cannot read what happened, it cannot improve. Structured logs > pretty logs. Always.
2) SQLite Is the Perfect Loop Database
Not for production. For iteration. The ability to query state instantly from CLI makes autonomous debugging possible.
3) Agents Need Observability, Not Prompts
Most people focus on prompt engineering. I focus on observability engineering.
Give the agent visibility into logs, state, outputs, errors, and the database. Then iteration becomes natural.
4) Humans Should Validate Outcomes — Not Steps
The human should only answer: “Is this what I asked for?” That’s what the agent is for.
My Current Loop Architecture (Simplified)
Specification → Agent writes code → Agent runs app → Agent tests → Agent reads logs/db →
Agent fixes → Repeat → Human validates outcome
If the loop works, progress becomes exponential.
If the loop is broken, everything slows down.
My Question to You
This is still evolving. I’m refining the process daily, and I’m convinced this is how development will work from now on:
agents running closed feedback loops with humans validating outcomes at the end.
So I’m curious:
- What tooling are you using?
- How are you creating feedback loops?
- Are you still inside the loop — or already outside watching it run?
Because once you close the loop…
you don’t want to go back.

by Joche Ojeda | Feb 9, 2026 | A.I
I wrote my previous article about closing the loop for agentic development earlier this week, although the ideas themselves have been evolving for several days. This new piece is simply a progress report: how the approach is working in practice, what I’ve built so far, and what I’m learning as I push deeper into this workflow.
Short version: it’s working.
Long version: it’s working really well — but it’s also incredibly token-hungry.
Let’s talk about it.
A Familiar Benchmark: The Activity Stream Problem
Whenever I want to test a new development approach, I go back to a problem I know extremely well: building an activity stream.
An activity stream is basically the engine of a social network — posts, reactions, notifications, timelines, relationships. It touches everything:
- Backend logic
- UI behavior
- Realtime updates
- State management
- Edge cases everywhere
I’ve implemented this many times before, so I know exactly how it should behave. That makes it the perfect benchmark for agentic development. If the AI handles this correctly, I know the workflow is solid.
This time, I used it to test the closing-the-loop concept.
The Current Setup
So far, I’ve built two main pieces:
- An MCP-based project
- A Blazor application implementing the activity stream
But the real experiment isn’t the app itself — it’s the workflow.
Instead of manually testing and debugging, I fully committed to this idea:
The AI writes, tests, observes, corrects, and repeats — without me acting as the middleman.
So I told Copilot very clearly:
- Don’t ask me to test anything
- You run the tests
- You fix the issues
- You verify the results
To make that possible, I wired everything together:
- Playwright MCP for automated UI testing
- Serilog logging to the file system
- Screenshot capture of the UI during tests
- Instructions to analyze logs and fix issues automatically
So the loop becomes:
write → test → observe → fix → retest
And honestly, I love it.
My Surface Is Working. I’m Not Touching It.
Here’s the funny part.
I’m writing this article on my MacBook Air.
Why?
Because my main development machine — a Microsoft Surface laptop — is currently busy running the entire loop by itself.
I told Copilot to open the browser and actually execute the tests visually. So it’s navigating the UI, filling forms, clicking buttons, taking screenshots… all by itself.
And I don’t want to touch that machine while it’s working.
It feels like watching a robot doing your job. You don’t interrupt it mid-task. You just observe.
So I switched computers and thought: “Okay, this is a perfect moment to write about what’s happening.”
That alone says a lot about where this workflow is heading.
Watching the Loop Close
Once everything was wired together, I let it run.
The agent:
- Writes code
- Runs Playwright tests
- Reads logs
- Reviews screenshots
- Detects issues
- Fixes them
- Runs again
Seeing the system self-correct without constant intervention is incredibly satisfying.
In traditional AI-assisted development, you often end up exhausted:
- The AI gets stuck
- You explain the issue
- It half-fixes it
- You explain again
- Something else breaks
You become the translator and debugger for the model.
With a self-correcting loop, that burden drops dramatically. The system can fail, observe, and recover on its own.
That changes everything.
The Token Problem (Yes, It’s Real)
There is one downside: this workflow is extremely token hungry.
Last month I used roughly 700% more tokens than usual. This month, and we’re only around February 8–9, I’ve already used about 200% of my normal limits.
Why so expensive?
Because the loop never sleeps:
- Test execution
- Log analysis
- Screenshot interpretation
- Code rewriting
- Retesting
- Iteration
Every cycle consumes tokens. And when the system is autonomous, those cycles happen constantly.
Model Choice Matters More Than You Think
Another important detail: not all models consume tokens equally inside Copilot.
Some models count as:
- 3× usage
- 1× usage
- 0.33× usage
- 0× usage
For example:
- Some Anthropic models are extremely good for testing and reasoning
- But they can count as 3× token usage
- Others are cheaper but weaker
- Some models (like GPT-4 Mini or GPT-4o in certain Copilot tiers) count as 0× toward limits
At some point I actually hit my token limits and Copilot basically said: “Come back later.”
It should reset in about 24 hours, but in the meantime I switched to the 0× token models just to keep the loop running.
The difference in quality is noticeable.
The heavier models are much better at:
- Debugging
- Understanding logs
- Self-correcting
- Complex reasoning
The lighter or free models can still work, but they struggle more with autonomous correction.
So model selection isn’t just about intelligence — it’s about token economics.
Why It’s Still Worth It
Yes, this approach consumes more tokens.
But compare that to the alternative:
- Sitting there manually testing
- Explaining the same bug five times
- Watching the AI fail repeatedly
- Losing mental energy on trivial fixes
That’s expensive too — just not measured in tokens.
I would rather spend tokens than spend mental fatigue.
And realistically:
- Models get cheaper every month
- Tooling improves weekly
- Context handling improves
- Local and hybrid options are evolving
What feels expensive today might feel trivial very soon.
MCP + Blazor: A Perfect Testing Ground
So far, this workflow works especially well for:
- MCP-based systems
- Blazor applications
- Known benchmark problems
Using a familiar problem like an activity stream lets me clearly measure progress. If the agent can build and maintain something complex that I already understand deeply, that’s a strong signal.
Right now, the signal is positive.
The loop is closing. The system is self-correcting. And it’s actually usable.
What Comes Next
This article is just a status update.
The next one will go deeper into something very important:
How to design self-correcting mechanisms for agentic development.
Because once you see an agent test, observe, and fix itself, you don’t want to go back to manual babysitting.
For now, though:
The idea is working. The workflow feels right. It’s token hungry. But absolutely worth it.
Closing the loop isn’t theory anymore — it’s becoming a real development style.

by Joche Ojeda | Feb 9, 2026 | A.I
Last week I was in Sochi on a ski trip. Instead of skiing, I got sick.
So I spent a few days locked in a hotel room, doing what I always do when I can’t move much: working. Or at least what looks like work. In reality, it’s my hobby.
YouTube wasn’t working well there, so I downloaded a few episodes in advance. Most of them were about OpenClaw and its creator, Peter Steinberger — also known for building PSPDFKit.
What started as passive watching turned into one of those rare moments of clarity you only get when you’re forced to slow down.
Shipping Code You Don’t Read (In the Right Context)
In one of the interviews, Peter said something that immediately caught my attention: he ships code he doesn’t review.
At first that sounds reckless. But then I realized… I sometimes do the same.
However, context matters.
Most of my daily work is research and development. I build experimental systems, prototypes, and proofs of concept — either for our internal office or for exploring ideas with clients. A lot of what I write is not production software yet. It’s exploratory. It’s about testing possibilities.
In that environment, I don’t always need to read every line of generated code.
If the use case works and the tests pass, that’s often enough.
I work mainly with C#, ASP.NET, Entity Framework, and XAF from DevExpress. I know these ecosystems extremely well. So if something breaks later, I can go in and fix it myself. But most of the time, the goal isn’t to perfect the implementation — it’s to validate the idea.
That’s a crucial distinction.
When writing production code for a customer, quality and review absolutely matter. You must inspect, verify, and ensure maintainability. But when working on experimental R&D, the priority is different: speed of validation and clarity of results.
In research mode, not every line needs to be perfect. It just needs to prove whether the idea works.
Working “Without Hands”
My real goal is to operate as much as possible without hands.
By that I mean minimizing direct human interaction with implementation. I want to express intent clearly enough so agents can execute it.
If I can describe a system precisely — especially in domains I know deeply — then the agent should be able to build, test, and refine it. My role becomes guiding and validating rather than manually constructing everything.
This is where modern development is heading.
The Problem With Vibe Coding
Peter talked about something that resonated deeply: when you’re vibe coding, you produce a lot of AI slop.
You prompt. The AI generates. You run it. It fails. You tweak. You run again. Still wrong. You tweak again.
Eventually, the human gets tired.
Even when you feel close to a solution, it’s not done until it’s actually done. And manually pushing that process forward becomes exhausting.
This is where many AI workflows break down. Not because the AI can’t generate solutions — but because the loop still depends too heavily on human intervention.
Closing the Loop
The key idea is simple and powerful: agentic development works when the agent can test and correct itself.
You must close the loop.
Instead of: human → prompt → AI → human checks → repeat
You want: AI → builds → tests → detects errors → fixes → tests again → repeat
The agent needs tools to evaluate its own output.
When AI can run tests, detect failures, and iterate automatically, something shifts. The process stops being experimental prompting and starts becoming real engineering.
Spec-Driven vs Self-Correcting Systems
Spec-driven development still matters. Some people dismiss it as too close to waterfall, but every methodology has flaws.
The real evolution is combining clear specifications with self-correcting loops.
The human defines:
- The specification
- The expected behavior
- The acceptance criteria
Then the AI executes, tests, and refines until those criteria are satisfied.
The human doesn’t need to babysit every iteration. The human validates the result once the loop is closed.
Engineering vs Parasitic Ideas
There’s a concept from a book about parasitic ideas.
In social sciences, parasitic ideas can spread because they’re hard to disprove. In engineering, bad ideas fail quickly.
If you design a bridge incorrectly, it collapses. Reality provides immediate feedback.
Software — especially AI-generated software — needs the same grounding in reality. Without continuous testing and validation, generated code can drift into something that looks plausible but doesn’t work.
Closing the loop forces ideas to confront reality.
Tests are that reality.
Taking the Human Out of the Repetitive Loop
The goal isn’t removing humans entirely. It’s removing humans from repetitive validation.
The human should:
- Define the specification
- Define what “done” means
- Approve the final result
The AI should:
- Implement
- Test
- Detect issues
- Fix itself
- Repeat until success
When that happens, development becomes scalable in a new way. Not because AI writes code faster — but because AI can finish what it starts.
What I Realized in That Hotel Room
Getting sick in Sochi wasn’t part of the plan. But it forced me to slow down long enough to notice something important.
Most friction in modern development isn’t writing code. It’s closing loops.
We generate faster than we validate. We start more than we finish. We rely on humans to constantly re-check work that machines could verify themselves.
In research and experimental work, it’s fine not to inspect every line — as long as the system proves its behavior. In production work, deeper review is essential. Knowing when each approach applies is part of modern engineering maturity.
The future of agentic development isn’t just better models. It’s better loops.
Because in the end, nothing is finished until the loop is closed.

by Joche Ojeda | Feb 4, 2026 | A.I
How GitHub Copilot Became My Sysadmin, Writer, and Creative Partner
When people talk about GitHub Copilot, they almost always describe it the same way: an AI that writes code.
That’s true—Copilot can write code—but treating it as “just a coding tool” is like calling a smartphone
“a device for making phone calls.”
The moment you start using Copilot inside Visual Studio Code, something important changes:
it stops being a code generator and starts behaving more like a context-aware work partner.
Not because it magically knows everything—but because VS Code gives it access to the things that matter:
your files, your folders, your terminals, your scripts, your logs, and even your remote machines.
That’s why this article isn’t about code autocomplete. It’s about the other side of Copilot:
the part that’s useful for people who are building, maintaining, writing, organizing, diagnosing, or shipping
real work—especially the messy kind.
Copilot as a Linux Server Sidekick
One of my most common uses for Copilot has nothing to do with application logic.
I use it for Linux server setup and diagnostics.
If you run Copilot in VS Code and you also use Remote development (SSH), you essentially get a workspace that can:
- Connect to Linux servers over SSH
- Edit remote configuration files safely
- Run commands and scripts in an integrated terminal
- Search through logs and system files quickly
- Manage folders like they’re local projects
That means Copilot isn’t “helping me code.” It’s helping me operate.
I often set up hosting and administration tools like Virtualmin or Webmin, or configure other infrastructure:
load balancers, web servers, SSL, firewall rules, backups—whatever the server needs to become stable and usable.
In those situations Copilot becomes the assistant that speeds up the most annoying parts:
the remembering, the searching, the cross-checking, and the “what does this error actually mean?”
What this looks like in practice
Instead of bouncing between browser tabs and old notes, I’ll use Copilot directly in the workspace:
- “Explain what this service error means and suggest the next checks.”
- “Read this log snippet and list the most likely causes.”
- “Generate a safe Nginx config for this domain layout.”
- “Create a hardening checklist for a fresh VPS.”
- “What would you verify before assuming this is a network issue?”
The benefit isn’t that Copilot is always right. The benefit is that it helps you move faster with less friction—
and it keeps your work inside the same place where the files and commands actually live.
Copilot as an Operations Brain (Not Just a Code Brain)
Here’s the real mental shift:
Copilot doesn’t need to write code to be useful. It needs context.
In VS Code, that context includes the entire workspace: configuration files, scripts, documentation, logs,
command history, and whatever you’re currently working on. Once you realize that, Copilot becomes useful for:
- Debugging infrastructure problems
- Translating “error messages” into “actionable steps”
- Drafting repeatable setup scripts
- Creating operational runbooks and checklists
- Turning tribal knowledge into documentation
It’s especially valuable when the work is messy and practical—when you’re not trying to invent something new,
you’re trying to make something work.
Copilot as a Writing Workspace
Now switch gears. One of the best non-coding Copilot stories I’ve seen is my cousin Alexandra.
She’s writing a small storybook.
She started the way a lot of people do: writing by hand, collecting pages, keeping ideas in scattered places.
At one point she was using Copilot through Microsoft Office, but I suggested a different approach:
Use VS Code as the creative workspace.
Not because VS Code is “a writing tool,” but because it gives you structure for free:
- A folder becomes the book
- Each chapter becomes a file
- Markdown becomes a simple, readable format
- Git (optionally) becomes version history
- Copilot becomes the editor, brainstormer, and consistency checker
In that setup, Copilot isn’t writing the story for you. It’s helping you shape it:
rewrite a paragraph, suggest alternatives, tighten dialogue, keep a consistent voice,
summarize a scene, or generate a few options when you’re stuck.
Yes, Even Illustrations (Within Reason)
This surprises people: you can also support simple illustrations inside a VS Code workspace.
Not full-on painting, obviously—but enough for many small projects.
VS Code can handle things like vector graphics (SVG), simple diagram formats, and text-driven visuals.
If you describe a scene, Copilot can help generate a starting SVG illustration, and you can iterate from there.
It’s not about replacing professional design—it’s about making it easier to prototype, experiment,
and keep everything (text + assets) together in one organized place.
The Hidden Superpower: VS Code’s Ecosystem
Copilot is powerful on its own. But its real strength comes from where it lives.
VS Code brings the infrastructure:
- Extensions for almost any workflow
- Remote development over SSH
- Integrated terminals and tasks
- Search across files and folders
- Versioning and history
- Cross-platform consistency
So whether you’re configuring a server, drafting a runbook, organizing a book, or building a folder-based project,
Copilot adapts because the workspace defines the context.
The Reframe
If there’s one idea worth keeping, it’s this:
GitHub Copilot is not a coding tool. It’s a general-purpose work companion that happens to be excellent at code.
Once you stop limiting it to source files, it becomes:
- A sysadmin assistant
- A documentation partner
- A creative editor
- A workflow accelerator
- A “second brain” inside the tools you already use
And the best part is that none of this requires a new platform or a new habit.
It’s the same VS Code workspace you already know—just used for more than code.

by Joche Ojeda | Jan 30, 2026 | C#, dotnet
There is a familiar moment in every developer’s life.
Memory usage keeps creeping up.
The process never really goes down.
After hours—or days—the application feels heavier, slower, tired.
And the conclusion arrives almost automatically:
“The framework has a memory leak.”
“That component library is broken.”
“The GC isn’t doing its job.”
It’s a comforting explanation.
It’s also usually wrong.
Memory Leaks vs. Memory Retention
In managed runtimes like .NET, true memory leaks are rare.
The garbage collector is extremely good at reclaiming memory.
If an object is unreachable, it will be collected.
What most developers call a “memory leak” is actually
memory retention.
- Objects are still referenced
- So they stay alive
- Forever
From the GC’s point of view, nothing is wrong.
From your point of view, RAM usage keeps climbing.
Why Frameworks Are the First to Be Blamed
When you open a profiler and look at what’s alive, you often see:
- UI controls
- ORM sessions
- Binding infrastructure
- Framework services
So it’s natural to conclude:
“This thing is leaking.”
But profilers don’t answer why something is alive.
They only show that it is alive.
Framework objects are usually not the cause — they are just sitting at the
end of a reference chain that starts in your code.
The Classic Culprit: Bad Event Wiring
The most common “mirage leak” is caused by events.
The pattern
- A long-lived publisher (static service, global event hub, application-wide manager)
- A short-lived subscriber (view, view model, controller)
- A subscription that is never removed
That’s it. That’s the leak.
Why it happens
Events are references.
If the publisher lives for the lifetime of the process, anything it
references also lives for the lifetime of the process.
Your object doesn’t get garbage collected.
It becomes immortal.
The Immortal Object: When Short-Lived Becomes Eternal
An immortal object is an object that should be short-lived
but can never be garbage collected because it is still reachable from a GC
root.
Not because of a GC bug.
Not because of a framework leak.
But because our code made it immortal.
Static fields, singletons, global event hubs, timers, and background services
act as anchors. Once a short-lived object is attached to one of these, it
stops aging.
GC Root
  └── static / singleton / service
        └── Event, timer, or callback
              └── Delegate or closure
                    └── Immortal object
                          └── Large object graph
From the GC’s perspective, everything is valid and reachable.
From your perspective, memory never comes back down.
A Retention Dependency Tree That Cannot Be Collected
GC Root
  └── static GlobalEventHub.Instance
        └── GlobalEventHub.DataUpdated (event)
              └── delegate → CustomerViewModel.OnDataUpdated
                    └── CustomerViewModel
                          └── ObjectSpace / DbContext
                                └── IdentityMap / ChangeTracker
                                      └── Customer, Order, Invoice, ...
What you see in the memory dump:
- thousands of entities
- ORM internals
- framework objects
What actually caused it:
- one forgotten event unsubscription
The Lambda Trap (Even Worse, Because It Looks Innocent)
The code
public CustomerViewModel(GlobalEventHub hub)
{
    hub.DataUpdated += (_, e) =>
    {
        RefreshCustomer(e.CustomerId);
    };
}
This lambda captures this implicitly.
The compiler creates a hidden closure that keeps the instance alive.
“But I Disposed the Object!”
Disposal does not save you here.
- Dispose does not remove event handlers
- Dispose does not break static references
- Dispose does not stop background work automatically
IDisposable is a promise — not a magic spell.
Leak-Hunting Checklist
Reference Roots
- Are there static fields holding objects?
- Are singletons referencing short-lived instances?
- Is a background service keeping references alive?
Events
- Are subscriptions always paired with unsubscriptions?
- Are lambdas hiding captured references?
Timers & Async
- Are timers stopped and disposed?
- Are async loops cancellable?
Profiling
- Follow GC roots, not object counts
- Inspect retention paths
- Ask: who is holding the reference?
Final Thought
Frameworks rarely leak memory.
We do.
Follow the references.
Trust the GC.
Question your wiring.
That’s when the mirage finally disappears.