All topics
291 articles.
Browse by topic
Articles

There's No ADB for iPhone: Automating React Native UI Tests on Real iOS Devices
If you come from Android like I do, you have a comfortable habit: plug in a device, talk to it over adb, script everything. So the natural question when you ship the iOS side of a React Native app is — can I do the same on a physical iPhone? The short answer is yes, but. And the 'but' lands squarely on the thing I care about most: running on a real device instead of a simulator.

Speech-to-Text in React Native: Four Ways to Reach Android Parity
My React Native app transcribes voice on iOS just fine — Apple hands you a recognizer and you're done. Then I went to reach parity on Android and found the usual mobile story: the easy path exists, but it's a different easy path, with different tradeoffs. Here are the four routes I weighed, and the two questions that actually decide which one you pick.

You Don't Need a GPU for Speech: Self-Hosting Whisper and TTS on a CPU VPS
The reflex when someone says 'speech-to-text' or 'text-to-speech' is to reach for a GPU. For real-time voice on a server, you mostly don't need one. The thing that actually makes CPU speech fast isn't CUDA — it's a set of instruction sets your cheap VPS already has. Here's how I run both transcription and synthesis on a plain CPU box, always-on, with no API keys and no GPU bill.

FOMO, JOMO, and FOWT — The Fear of Wasted Tokens
I pay for the max plans — Codex and Claude Code — plus a monthly Azure token allotment. Here's the thing nobody warns you about: those are monthly quotas. Use them or lose them. And I've caught myself genuinely afraid to oversleep or take a day trip, because that's quota I'll never get back. That feeling needed a name, so I gave it one: FOWT, the Fear Of Wasted Tokens.

What Is Token Maxxing? Spending Compute to Buy Correctness
There's a piece of slang making the rounds in the AI dev world: token maxxing. Strip away the meme and it names something real — the deliberate choice to spend more tokens on a problem because tokens have become the cheapest thing you can throw at it. Here's what it actually means, when it works, and when you're just lighting money on fire.

The Vision Model That Wasn't There: DeepSeek V4, a Vanished Paper, and a Recipe You Can Use Today
I set out to wire DeepSeek V4's much-described image-understanding into a side project — the model that 'calculates bounding boxes and relative dimensions step by step.' One problem: DeepSeek V4 can't see images at all. This is the detective story of how I found that out three different ways, the vanished research paper that explains where the claim came from, and the lesson that mattered most — a method is portable even when a model isn't. So I ported the recipe to Gemini and measured it.

What Is OpenAI Codex Sites? Prompt-to-Hosted-App, With a Catch
OpenAI's Codex picked up a feature called Sites: describe an app in plain language and Codex builds it, runs it, deploys it, and hands you back a live hosted URL — no deploy pipeline of your own. It's a genuinely interesting glimpse of where agents are heading. It also ships with some walls worth knowing about before you get excited. Here's the honest rundown.

LM Studio 0.4.16: Your Local Models Just Went Mobile
LM Studio is the app I reach for whenever I want to run a model on my own hardware, and the 0.4.16 release adds the thing I didn't know I wanted: a mobile app called Locally that lets me drive my big desktop models from my phone over LM Link. Here's what's new, and why this is a bigger deal than a point release sounds.

Static Analyzers: How They Work and Why You Actually Need Them
A static analyzer reads your code without running it and tells you what's wrong — the bug you didn't see, the await you forgot, the disposable you leaked. After twenty years of .NET I treat them as non-negotiable. Here's what they actually are, how they work under the hood (with a peek at Roslyn), and why every serious project should have them turned on and turned up.

What Is ACP? The Agent Client Protocol — LSP, but for AI Coding Agents
If you've watched the AI coding space lately, you've heard about MCP. Its quieter cousin is ACP — the Agent Client Protocol — and it solves a different problem: not how an agent talks to its tools, but how your editor talks to the agent. The one-line version: if MCP is USB-C for AI tools, ACP is LSP for AI agents. Here's what it is and why I think it matters.

What Is dotnetup? The .NET Version Manager We've Been Missing
If you've ever fought with which .NET SDK is on a machine — the one Visual Studio dragged in, the one winget installed, the one the install script dropped, the one your global.json actually wants — then dotnetup is for you. It's the official .NET SDK and runtime version manager, finally: rustup/nvm, but for .NET. Here's what it is and why I'm excited about it.

Chat, Agent, Harness: The Three Layers of Building with AI
Three words get thrown around as if they were the same thing — chat, agent, harness — and they are not. They're three different layers, and once you see the boundaries between them, a lot of the AI-for-developers landscape suddenly makes sense. Here's how I think about the distinction, with small code sketches for each layer.

Microsoft Execution Containers (MXC): Build 2026's Answer to the Shared-Kernel Problem
A couple of days ago I wrote that namespaces are the operating-system feature AI agents were waiting for — and that the one real catch is the shared kernel. Turns out Microsoft spent Build 2026 answering exactly that. Microsoft Execution Containers (MXC) swap the shared kernel for hypervisor-enforced boundaries while keeping container-class speed: under 5% CPU overhead, 40–60 MB per container, dozens of agents on one workstation. Here's what it is and why I, a Windows person, am genuinely excited about it.

Namespaces: The Operating System Feature AI Agents Were Waiting For
Linux namespaces have been quietly sitting in the kernel since around 2008, powering every container you've ever run. I never thought much about them until I started running AI agents — and then it clicked. Namespaces are arguably a better fit for agents than they ever were for ordinary apps, because an agent is the one workload that is both cheap to spawn by the hundred and fundamentally untrustworthy.
One Command to Generate, Test, Rank, and Merge an Agent Fan-Out
Over the last three posts I built the pieces of a best-of-N agent pipeline one at a time: git worktrees for isolation, a fan-out script to generate N attempts in parallel, and a judging stage to find the winner. This is the capstone — one ~50-line orchestrate.sh that chains all of it into a single command. You give it a count, an agent command, and a test command; it fans out, eliminates the runs that fail the tests, ranks the survivors, shows you the winning diff, and merges it only if you say yes. I built it, ran it end to end, and pasted the real output — including the one rough edge worth knowing about.

Judging the Winner: Tests and LLM-as-Judge as the Referee
The fan-out script from the last post hands you N finished attempts at the same task and then stops — it deliberately leaves the hardest question to you: which one is actually best? This post is about turning that judgment into a real pipeline. A two-stage referee: tests as the objective first cut that eliminates anything broken, then a quality judge — your eyes for small diffs, an LLM-as-judge when there are too many to read — to pick among the survivors. I built the test stage, ran it, and pasted the real output, then laid out the judging recipe and the ways it quietly lies to you.

A Real Agent Fan-Out: One Task, N Worktrees, Pick the Winner
In the last post I argued that git worktrees are the substrate that makes safe parallel agents possible. This is the hands-on follow-up: a small, real bash script that spins up N isolated worktrees, runs the same task in each one at the same time, and prints a diff summary so you can pick the best result and throw the rest away. I built it, ran it, and pasted the actual output. It's about forty lines, and once you see it work, the 'fan out, compare, keep the winner' pattern stops being a buzzword and becomes something you can run this afternoon.

Git Worktrees, and How Coding Agents Use Them
For years I treated a git repo as a single desk: one working directory, one branch checked out at a time, and a lot of stashing whenever I had to jump between tasks. Git worktrees quietly fix that — they let one repository have many working directories at once, each on its own branch, all sharing the same history. That used to be a nice convenience. Now that I run coding agents in parallel, it's become essential infrastructure: the cleanest way to let several agents work at the same time without clobbering each other. Here's what worktrees are, the handful of commands you actually need, and why every serious agent harness reaches for them.

Would an Agent Framework Fix It? What Microsoft and Copilot Change About LLM Code Migration — and What They Don't
In my last post I argued that when you point an LLM at a large legacy migration, the model is the easy part — the hard part is the harness around it. A fair follow-up question landed almost immediately: what if you don't hand-build that harness? What if you reach for a real agent framework — Microsoft Agent Framework, Semantic Kernel, Microsoft.Extensions.AI, or the GitHub Copilot SDK? Do the problems go away? The honest answer is that a good framework dissolves some of them outright and relocates the rest. The mechanical problems (feeding context, applying edits) largely vanish. The judgment problems (knowing when to stop, the domain rules, what 'done' means, measuring whether you're improving) are still yours, no matter how good the framework is.

Automating a Legacy Migration with LLMs: The Model Was Never the Hard Part
If you have ever stared at a half-million-line legacy application and wondered whether an LLM could just migrate it for you, this post is for you. The short version: it can do a lot — but the model turns out to be the easy part. The hard part is everything around it. After pointing language models at a large legacy codebase, here are the lessons that actually mattered, and none of them are about prompt engineering: why the diff-apply approach fights you, why a model that refuses is doing you a favor, when to stop retrying, the framework wall you cannot code your way around, and why I landed on a hybrid of a structured pipeline and an agentic tool.

Decompiling and Recompiling .NET Apps — and How to Protect Your Binaries
Hand someone a .NET DLL and you've handed them most of your source code. C# doesn't compile to machine code — it compiles to IL, and the IL carries your class names, method names, and structure right along with it. The good news is that the same property makes great tools possible; the uncomfortable news is that anyone can read, patch, and recompile your app in an afternoon. Here's how decompilation actually works, a real decompile-patch-recompile loop, and the honest menu of things you can do to make it harder.

imgproxy: Getting Back the One Thing I Missed from Appcelerator Titanium
Sharing the same images between a mobile app and a web app — each sized right for its screen — is a problem I've been chasing for years. Back in my Appcelerator Titanium days, the cloud backend solved it for me: upload a photo once, get back properly sized versions for whoever asked. Then that service went away. imgproxy is how I get that capability back — self-hosted, open source, and serving every app in my fleet from a single URL.

Getting Started with Microsoft.Extensions.AI — Part 4: Tools, Functions & the Agent Framework
Let's empower our LLMs to interact with the real world by letting them call our C# code, then see how the Agent Framework elevates this to autonomous orchestration.

What Is Postiz? Self-Hosting Your Social Scheduling (and the Gotchas Nobody Warns You About)
Postiz is an open-source, self-hostable social media scheduler — think Buffer or Hootsuite, but running on your own box with your own API key. I moved my channels onto it and it's genuinely good. It also taught me four things the README is quiet about: a YouTube token that dies every seven days, two completely separate auth systems, a reschedule endpoint the public API can't touch, and the fact that some platforms simply won't talk to a personal account at all — they demand a business or creator account first. Here's what Postiz is, why you'd self-host it, and the gotchas so you don't lose an afternoon to them like I did.

A Practical Guide to Cheap and Local AI: OpenRouter, Gateways, and Local Models
In Part 1 I argued that price is a feature and that the real skill is right-sizing the model to the task. This is the how-to: the three tiers of cheap inference (aggregators like OpenRouter, a self-hosted gateway, and fully local models), how to point your coding tools at them with bring-your-own-key, how to route a request to the cheapest model that can do the job, and how to run a blind eval so you actually know your cheap model is good enough. Tools and config, no vendor lock-in.

Price Is a Feature: The Case for Cheap and Local AI Models
I've got the local-model disease, and I don't want a cure. New cheap and open-weight models drop every week, prices on the frontier keep climbing, and somewhere in there is a quiet truth most agentic-coding hot-takes miss: price is a feature. A model that costs cents instead of dollars doesn't just save money — it changes how you work, removes the mental tax on every prompt, and makes 'right-size the model to the task' the actual skill. Here's why I think cheap-and-local is the most important trend in AI tooling right now.

WWDC Deep Dive, Part 3: Xcode 27's Real Story — the Agent Client Protocol, MCP, and the End of the Simulator
The OS was a tick year, but Xcode 27 is where Apple made a serious play. It speaks MCP, it added a real chat experience — and the sleeper feature is the Agent Client Protocol, which lets you plug your own CLI harness (Copilot, Claude, and the rest) into native Xcode. Meanwhile the simulator is being replaced by a Device Hub, and the whole thing points at the 'closing the loop' wave that native developers have been late to. Here's what changed in the part of WWDC that actually affects how you write code.

WWDC Deep Dive, Part 2: Safari Goes Vibe-Coding — On-the-Fly Extensions, Notify Me, and Apple's Quiet Web-Scraping Turn
The most interesting thing Apple did at WWDC wasn't a model — it was Safari quietly becoming a vibe-coding surface. You can now describe a browser extension in natural language and have Safari generate it on the fly, ask it to 'notify me when this page changes,' and let it change passwords for you in the background. It's clever and a little unsettling, and it points at a question every app developer should be asking: how do I make MY app scriptable by natural language?

Getting Started with Microsoft.Extensions.AI — Part 3: Pipelines, Embeddings & Search
Let's dive into some powerful `Microsoft.Extensions.AI` features: building flexible request pipelines with middleware and performing semantic search with embeddings.

WWDC Deep Dive, Part 1: Apple's Native AI for Developers — Foundation Models, Free Cloud Compute, and the Siri Intent Trap
Apple's WWDC was a 'tick' year for the OS, but for developers building AI features it quietly moved the needle. The on-device model got smarter, there's now a bigger server-backed model that's free for small developers, and there's even a foundation-models CLI. The catch is everything around it: a confusing two-framework story, a plugin system for third-party models, and a Siri integration that still makes you pour your app into Apple's pre-defined schemas instead of just letting you ship an MCP server. Here's what actually matters if you build apps.

Control Your Android Phone From Your Desktop With scrcpy
A phone is a tiny screen you tap with one finger. A desktop has a real keyboard, a real pointer, and a 27-inch display. So why do I keep picking the phone up to do something I could do faster from the machine already in front of me? scrcpy fixes that: it puts a live, controllable window of your Android phone on your desktop — no app to install on the phone, no root, no cloud. Here's what it is, how it works, and the setup I actually use.

Brownfield Projects Are a Gold Mine for Training Agents
In my last post I described teaching an assistant my 'house style' by grading it against hidden golden cases. The obvious question is: where do you get the gold? Everybody's instinct is to start a clean little repo with tidy examples. That's exactly backwards. The richest training material I own isn't the shiny new project — it's the big, old, crusty brownfield beast nobody wants to touch. It's been quietly labeling a dataset for ten years. Here's why the mess is the treasure.

Teaching a Machine Your House Style
I have a 'house style' — that collection of small, stubborn opinions about how a thing should be built that I can no longer fully explain. A junior writes something that compiles, passes the tests, ships, and I still feel an itch on the back of my neck, because it isn't how we do it here. So I asked myself a more interesting question than 'can an AI write code': could I teach a machine my house style? Could I get it to write code that doesn't make me itch? This is the story of how I stopped asking the assistant to write good code and started giving it an exam it could fail.

One Key, One IP: A Self-Hosted AI Gateway for a Fleet of Agents
I run a small fleet of AI agents — coding agents, automation scripts, a few experiments — spread across a Mac, a Linux box and a couple of servers. Every one of them wanted its own set of API keys (OpenAI, OpenRouter, Azure), and every one of them called the providers from a different IP, which is a great way to get rate-limited and flagged. So I built a gateway: one box that holds the keys, exposes a single OpenAI-compatible endpoint, and makes every upstream call from one stable address. Here's the whole thing — LiteLLM, a forward proxy, and the two gotchas that cost me an hour.

A Self-Hosted SSH Mesh: Keyless Access to Every Machine With Headscale
I have machines scattered across the planet — a Mac Studio, a Linux laptop, a VPS — sitting behind different NATs, on different continents, with IP addresses that change without warning. Getting an SSH session from one to another used to mean port forwards, dynamic-DNS hacks, and a graveyard of public keys. So I built a mesh: a self-hosted Tailscale control plane with Headscale, where every machine gets a stable address and `ssh linux-laptop` just works from anywhere, with no keys to manage at all.

Getting Started with Microsoft.Extensions.AI — Part 2: Messages & Strongly-Typed Output
Let's level up our AI interactions by building rich, multimodal messages and getting strongly-typed C# objects back from our models.

Microsoft's New AI Models from Build 2026: Aion and MAI, and How to Actually Use Them
At Build 2026 Microsoft shipped two very different kinds of AI model: Aion 1.0, a pair of small models that run on-device inside Windows, and the MAI family (Image-2.5, Transcribe-1.5), which live in the cloud. The interesting part isn't the benchmarks — it's where each one runs. Here's what they are and, more usefully, exactly how you can use each one depending on whether you're on a Mac, a Copilot+ PC, or just want a cloud API.

EnvPane: How a Windows Person Manages Environment Variables on a Mac
I'm a Windows person at heart — Windows Terminal just feels right, especially how trivially you can bump the font size. The macOS Terminal never clicked for me, so I never settled into the 'edit your shell rc' way of managing environment variables. And I have a lot of them: API keys and secrets for AI agents and day-to-day dev. EnvPane is the little preference pane that solved it — a GUI list of variables, applied to every app instantly.

Getting Started with Microsoft.Extensions.AI — Part 1: One Interface, Any Model
Discover how `Microsoft.Extensions.AI` provides a single `IChatClient` interface to seamlessly swap between cloud and local LLM providers with just one line of code.

Microsoft VibeVoice: Frontier Open-Source Voice AI, and How to Run It Locally
VibeVoice is Microsoft's open-source frontier voice-AI family — long-form, multi-speaker podcasts from text, a real-time streaming TTS model, and a 60-minute ASR model. It's also a cautionary tale: the headline TTS model was pulled over deepfake misuse. Here's what it does, the clever 7.5 Hz architecture behind it, and exactly how to run the parts you still can locally — including on Apple Silicon.

Graphify: Turn Any Folder Into a Knowledge Graph Your LLM Can Actually Use
Pointing an AI coding assistant at a big codebase means it re-reads the same raw files over and over, burning tokens and blowing past the context window. Graphify does the expensive analysis once and compresses a whole folder — code, PDFs, screenshots, diagrams — into a queryable knowledge graph the LLM traverses instead. On a real mixed corpus: 71.5× fewer tokens per query.

Stop Feeding LLMs Raw Files: Save Tokens with Microsoft MarkItDown (CLI + MCP)
Every PDF, Word doc, spreadsheet, or web page you hand an LLM gets paid for in tokens — and raw formats are full of markup the model doesn't need. Microsoft's MarkItDown converts all of them to clean, token-efficient Markdown. I measured a real page: 793 KB of HTML became 304 KB of Markdown — about 62% fewer tokens. Here's the tool, its CLI, and its MCP server.

Making a Country Legible to AI: My mcp.sv Hobby Project
mcp.sv is a hobby project of mine with one goal: make the whole state of El Salvador visible from one place, to any AI client. This is the reflective version — why I built it, what it covers today (279 documents across 11 categories), and the real question underneath it: what does it actually take to make a country legible to an AI?

How mcp.sv Does Multilingual Search and Structured RAG
mcp.sv — the El Salvador national MCP — has to answer questions about Salvadoran law and government in Spanish, English, and Russian, over documents that are almost entirely Spanish. Here's how it does it: not with one big multilingual model at query time, but with layers — synthetic cross-language aliases, language-specific full-text search, heading-aware structured chunking, and a hybrid keyword+vector blend, all precomputed so the read path stays fast and inference-free.

Set XAF Blazor ViewItems Free: Direct URLs, Parameters, and a REST API
An XAF ViewItem is normally trapped inside the app — reachable only after login and navigation. No shareable link, no URL parameters, no way to call it from a bot. Here's a pattern that frees it: build the ViewItem's UI as a plain Blazor component, then surface that one component three ways — the XAF ViewItem, a routable /chat?message=… page, and a REST API.

Getting Started with Semantic Kernel — Part 3: Running Local Models (LM Studio / Ollama)
In the final part of our Semantic Kernel series, I'll show you how to run your Semantic Kernel applications against local LLMs like LM Studio or Ollama, completely eliminating cloud costs while keeping your existing kernel code almost untouched.

Why We Added JWT Refresh Tokens to the XAF Web API (and How)
The XAF Web API hands you JWT authentication out of the box — but with a long-lived, stateless access token you can't revoke. That's a security problem and a UX problem. Here's why we layered refresh tokens with rotation and reuse-detection onto XAF's security system, and the real XPO-backed code that does it.

Reading Image-Only PDFs with a Local Model: Azure Foundry Local
A companion to the LM Studio post: extract text from scanned, image-only PDFs using Microsoft's Azure Foundry Local as the on-device model runtime. Foundry Local's catalog is text-only today, so the honest design splits the work — Tesseract turns pixels into raw text, and a local Phi/Qwen model cleans, structures and summarizes it. All on your own hardware, no cloud.

Reading Image-Only PDFs with a Local Vision Model (LM Studio)
Some PDFs aren't really PDFs — they're photos of paper with a .pdf extension and no text layer. Here's how I extract their text with a vision LLM running entirely on a local machine via LM Studio: render each page to a PNG, send it to an OpenAI-compatible /v1/chat/completions endpoint, get the transcription back. No cloud, no API bill.

Integrating Keycloak Authentication into a DevExpress XAF Blazor App
A complete, working recipe for wiring Keycloak OpenID Connect into a DevExpress XAF Blazor Server app — the auth provider, the bridge middleware, the three-layer logout, and the one checkbox (PKCE) that wastes everyone's afternoon. Full source on GitHub.

Getting Started with Semantic Kernel — Part 2: Kernel Functions & Plugins
In Part 2 of our Semantic Kernel series, we go beyond basic text generation. Learn how to empower your kernel to perform actions by creating prompt-based and native C# kernel functions, organizing them into plugins, and enabling automatic function calling to let the AI model execute your code.

Getting Started with Semantic Kernel — Part 1: Your First Kernel & Chat History
Dive into Microsoft Semantic Kernel with .NET 9! In this first part, we'll build our initial Kernel, explore how prompt detail influences AI responses, and learn to maintain conversation context using Chat History, including tracking token usage.

Local AI Studio — Part 6: Giving the Reel a Soundtrack (Local Music Generation)
A silent reel is half a reel. So I generated the music locally too — same machine, no cloud — and stitched it onto the video with one ffmpeg command. Here's how, with the working engine (MusicGen), the one that failed in an instructive way (ACE-Step), and the mux step in between.

Local AI Studio — Part 5: A 15-Second Reel, and When *Not* to Use a Video Model
I wanted a 15-second vertical reel of rural El Salvador's coast — fishing lanchas, palms, a sunset over the Pacific — in a papercut, Cubist, folk-art style. Every instinct said 'use a text-to-video model.' Every instinct was wrong. Here's why I built it from still images instead, the reasoning, the real numbers, and the finished reel playing in the page.

Local AI Studio — Part 4: Local Video With LTX-Video and Wan 2.1
Part 4: generating video locally on a Mac. LTX-Video and Wan 2.1 both run on Apple Silicon — slowly, but they run. Plus the one MPS gotcha that turned my first Wan clip into rainbow soup, and the one-word fix that solved it.

Local AI Studio — Part 3: FLUX, SDXL, and the fp8-vs-GGUF Myth
Part 3: real timings for SDXL and FLUX on an M1 Max — and the moment my 'obvious' fix for slow FLUX (switch fp8 to GGUF) turned out to change nothing at all. A short lesson in measuring before you believe.

Local AI Studio — Part 2: Driving ComfyUI From Code
Part 2: ComfyUI's node graph is just JSON, and there's an HTTP API behind the pretty interface. That combination turns image generation into a plain function you can call from a script — batch it, loop it, run it overnight. Here's the whole pattern in about 60 lines.

Local AI Studio — Part 1: Installing ComfyUI on Apple Silicon
Part 1 of building a local AI studio on a Mac. We install ComfyUI on Apple Silicon the boring, reliable way — a clean Python venv with MPS-enabled PyTorch — pull the model zoo, and confirm the GPU is actually in play before we generate a single pixel.

Building a Local AI Image & Video Studio on a Mac Studio: A Hands-On Series
I turned my Mac Studio into a fully local AI image and video studio with ComfyUI — no cloud, no API keys, no per-image bill. This is the map for a hands-on series: installing it on Apple Silicon, driving it from code, the FLUX-vs-SDXL reality, and generating video locally with LTX and Wan.

Getting Started with the GitHub Copilot SDK — Part 11: Bring Your Own Key (BYOK) with OpenRouter
The final part of the series: point the Copilot SDK at any model — OpenRouter, Anthropic, Azure OpenAI, xAI — through Bring Your Own Key. No new SDK, no direct API calls. Custom models just show up in your model list.

Getting Started with the GitHub Copilot SDK — Part 10: A Full-Stack Blazor Chat App
Part 10 wires everything together — a Blazor Server chat app that talks to the GitHub Copilot SDK, calls real EF Core tools against a Northwind database, and renders markdown answers in the browser.

Getting Started with the GitHub Copilot SDK — Part 9: MCP Servers & Custom Agents
Part 9 of the GitHub Copilot SDK series: wire external MCP tool servers into a session and define named custom agents with their own prompts, tool limits, and isolated MCP connections — then combine both into a real agent architecture.

Getting Started with the GitHub Copilot SDK — Part 8: Skill Loading & Configuration
Part 8 of the GitHub Copilot SDK series. Skills are plain Markdown files that reshape how the model behaves — no code changes, no system-prompt surgery. We load one, prove it works, disable it by name, and build one at runtime.

Getting Started with the GitHub Copilot SDK — Part 7: Infinite Sessions & Context Compaction
Every LLM has a finite context window, so long chats eventually run out of room. The Copilot SDK fixes this with Infinite Sessions — it automatically compacts old messages so a conversation can run forever.

Getting Started with the GitHub Copilot SDK — Part 6: Asking the User for Input
Part 6 of the GitHub Copilot SDK series. Sometimes the model needs something only the user can give it — a preference, a confirmation, a choice. Here's how the ask_user tool turns a one-way chat into a real back-and-forth.

Getting Started with the GitHub Copilot SDK — Part 5: Permission Request Handling
Part 5 of the GitHub Copilot SDK series. When the model wants to write a file or run a command, the SDK asks you first. This is the OnPermissionRequest handler — your safety gate between the model and the real world.

Getting Started with the GitHub Copilot SDK — Part 4: Pre/Post Tool-Use Hooks
Part 4 of the GitHub Copilot SDK series. Hooks let you sit in the middle of every tool call — log it, allow it, or deny it outright — for auditing, access control, and human-in-the-loop approval.

Getting Started with the GitHub Copilot SDK — Part 3: Custom Tools with AIFunction
Part 3 of the GitHub Copilot SDK series: turn plain C# methods into tools the model can call — simple functions, multiple tools, complex record types, safe error handling, and filtering the built-in tools.

Getting Started with the GitHub Copilot SDK — Part 2: Sessions, Events & Multi-Turn Conversations
Part 2 of the GitHub Copilot SDK series. We move past the client and into the real work — creating stateful sessions, subscribing to the event stream, streaming tokens, customizing the system prompt, and resuming a conversation.

Getting Started with the GitHub Copilot SDK — Part 1: Client Lifecycle & Connection
Part 1 of a hands-on series on the GitHub Copilot SDK for .NET. We start where every app has to start — the client: create it, connect it, prove it's alive and authenticated, list your models, and shut it down cleanly.

Getting Started with the GitHub Copilot SDK for .NET: A Hands-On Series
I built a hands-on course for the GitHub Copilot SDK in .NET — eleven small, self-contained demos that take you from the client connection all the way to MCP servers, custom agents, and bring-your-own-key models. Here's the map.
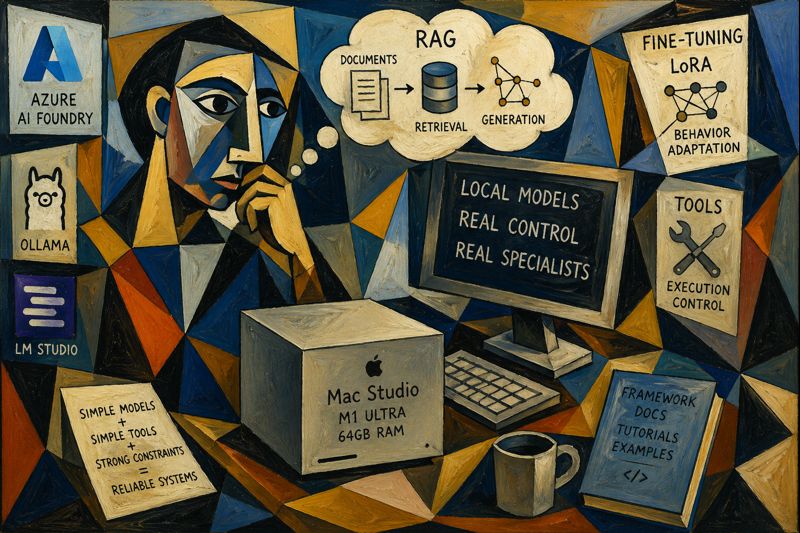
From Frontier Models to Local Specialists: My Mac Studio Experiment
After getting access to a Mac Studio in Arizona, I explored running local AI models using tools like Ollama and LM Studio. Instead of chasing frontier-level intelligence, I focused on turning small open-source models into reliable specialists using RAG, fine-tuning, and constrained tools—prioritizing control, predictability, and real-world usefulness.

How CLI Tools Can Drastically Reduce Token Consumption ⚡
After realizing that traditional tool schemas were burning tokens, I started looking for a lighter approach. CLI-style tools turned out to be a practical solution. By replacing verbose JSON schemas with simple commands, I reduced prompt size, improved tool selection, and made agents cheaper, faster, and easier to scale.

From “Hello” to Quota Exceeded: The Day My Agent Broke 💥
After building an agent with 50 tools, I expected powerful automation. Instead, users hit quota limits after saying “Hello.” The problem wasn’t usage, it was hidden context cost. Every tool was injected into every request, burning tokens instantly. This experience revealed why tool design and loading strategy matter for scalable, efficient AI agents.
The Day I Integrated GitHub Copilot SDK Inside My XAF App (Part 2)
In this second part, I integrate the GitHub Copilot SDK directly into a DevExpress XAF application, transforming a traditional business app into an AI-powered assistant. Using real tools, EF Core data, and DevExpress AI components, the system enables natural language interaction, record creation, and insights inside both Blazor and WinForms interfaces.
The Day I Integrated GitHub Copilot SDK Inside My XAF App (Part 1)
This week, while studying Russian every day, I noticed I kept relying on GitHub Copilot inside VS Code more than anything else. That curiosity turned into an experiment: what if Copilot lived inside my XAF apps? It worked… after a four-hour rabbit hole of model-related timeouts.

Closing the Loop with AI (part 3): Moving the Human to the End of the Pipeline
Closing the loop with AI means moving the human to the end of the pipeline. Let agents write, run, test, read logs, inspect state, and iterate without you acting as QA. With Serilog, SQLite, and Playwright, the loop becomes observable and repeatable—until you only validate outcomes, not steps.

Closing the Loop (Part 2): So Far, So Good — and Yes, It’s Token Hungry
Closing the loop is working better than I expected. Copilot writes code, runs Playwright tests, reads Serilog logs, checks screenshots, fixes bugs, and retries without me babysitting it. I’m writing this on my MacBook Air while my Surface runs tests. The only downside: it’s extremely token hungry.

Closing the Loop: Letting AI Finish the Work
Getting sick on a ski trip led to an unexpected realization: the future of AI-assisted development isn’t just generating code faster, but closing the loop. By giving agents the ability to test, fail, and self-correct, we can move from endless prompting to true autonomous engineering — where humans define outcomes, not implementations.

Github Copilot for the Rest of Us
GitHub Copilot isn’t just a code writer—it’s a context-aware work partner inside VS Code. With terminals, files, and Remote SSH, it helps diagnose and set up Linux servers, draft runbooks, and organize creative projects like storybooks. Treat it like a workspace companion, and the use cases multiply fast.

The Mirage of a Memory Leak (or: why “it must be the framework” is usually wrong)
Memory leaks in managed runtimes are often mirages. What looks like a broken framework is usually memory retention caused by our own code: forgotten event unsubscriptions, captured lambdas, static references, and background services. Follow the GC roots, not the blame, and the illusion disappears.

As an XAF Developer, What Should I Actually Test?
With AI making code cheaper than ever, the real challenge is no longer writing features but protecting business decisions. In XAF applications, effective testing means focusing on your logic, not the framework. Test services and decisions, isolate XAF with seams, use adapters wisely, and rely on integration tests for confidence

Application Installers and Assembly Resolution Using the Legacy .NET Framework
A real-world look at deploying legacy .NET Framework applications. From assembly probing and the GAC to installers that expose hidden dependencies, this article explains why copying DLLs is not deployment—and how understanding runtime resolution rules turns fragile brownfield systems into predictable, maintainable software.
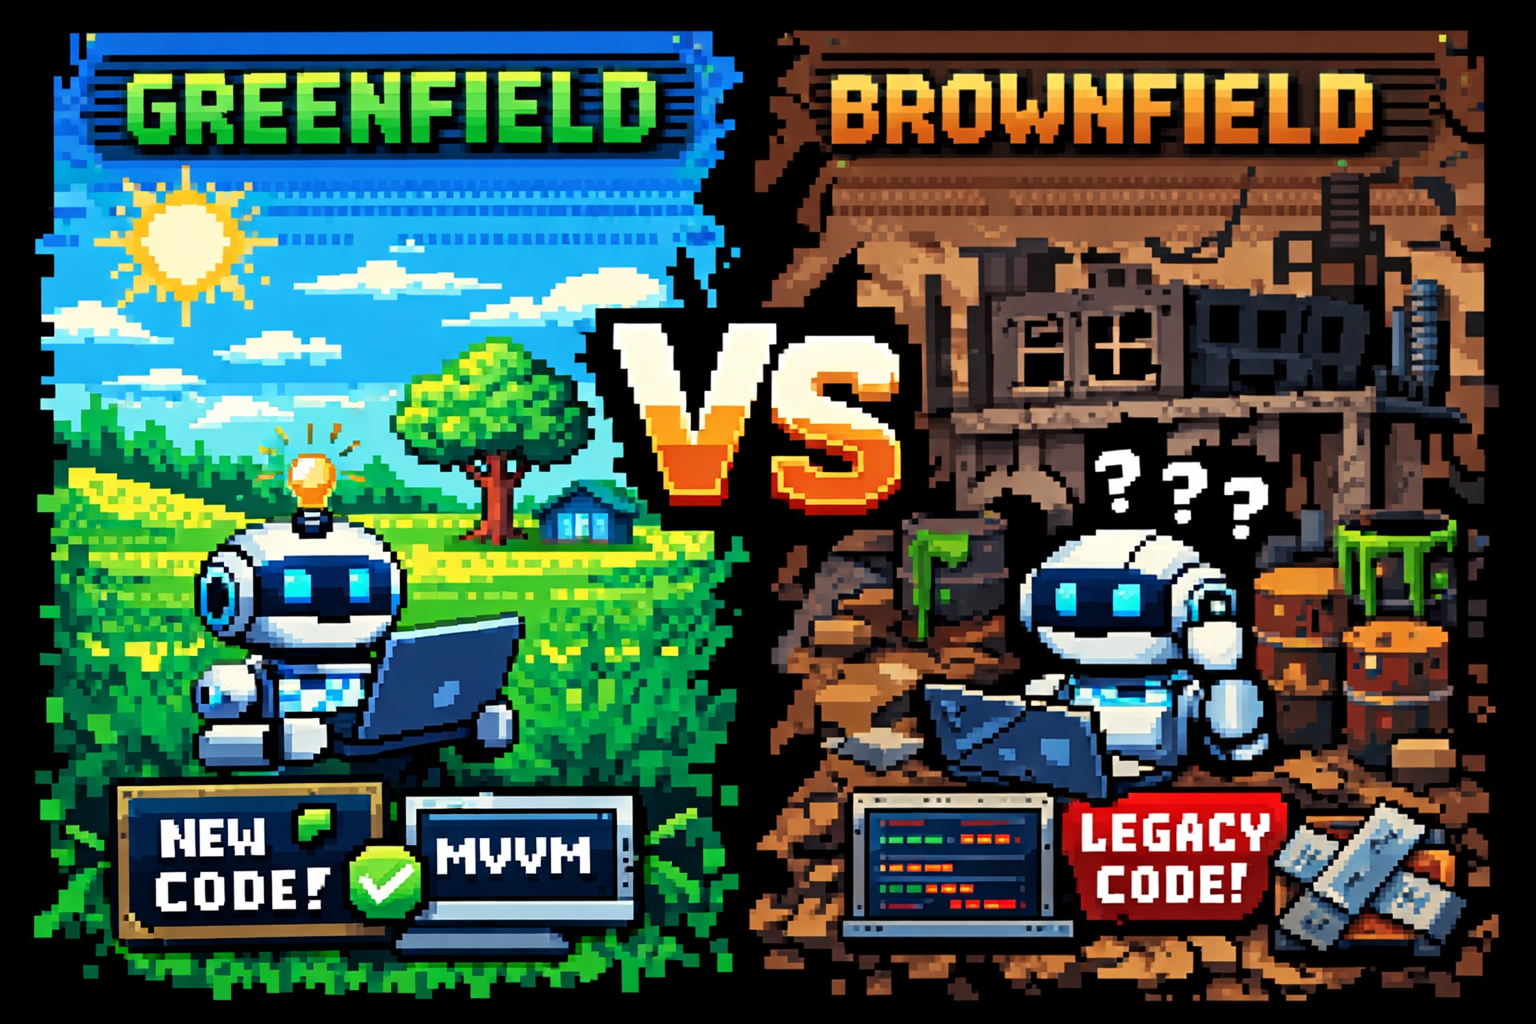
Greenfield vs Brownfield: How AI Changed the Way I Build and Rescue Software
Greenfield projects let us design clean architectures from day one. Brownfield projects force us to face history, shortcuts, and technical debt. With AI, that trade-off changes. Today we can modernize fragile legacy systems safely—adding tests, improving structure, and delivering real business value without risky rewrites.
The DLL Registration Trap in Legacy .NET Framework Applications
If you’ve ever worked on a traditional .NET Framework application — the kind that predates .NET Core and .NET 5+ — this story may feel painfully familiar. I’m talking about classic .NET Framework 4.x applications (4.0, 4.5, 4.5.1, 4.5.2, 4.6, 4.6.1, 4.6.2, 4.7, 4.7.1, 4.7.2, 4.8, and the final release 4.8.1). These systems often live […]
ConfigureAwait(false): Why It Exists, What It Solves, and When Context Is the Real Bug
Async bugs in C# are often context bugs. ConfigureAwait(false) doesn’t magically fix deadlocks, but it limits the damage when async code is blocked. This article explains context capture, blast radius, and a real production incident where the true fix was using the correct framework synchronization context.
Structured RAG for Unknown and Mixed Languages
This article shows how naïve RAG fails on multilingual activity streams and why structure is the real fix. By extracting stable metadata into a JSON schema at write time, RAG becomes predictable again. Structured RAG trades extra processing for accuracy, debuggability, and reliable retrieval across mixed and unknown languages.
RAG with PostgreSQL and C# (pros and cons)
This article was born from a real failure while applying RAG to an activity stream. Multilingual, unstructured user content broke naïve retrieval. The experience exposed how fragile RAG can be without structure, language awareness, and disciplined pipelines—lessons learned only after deploying RAG in a real system.
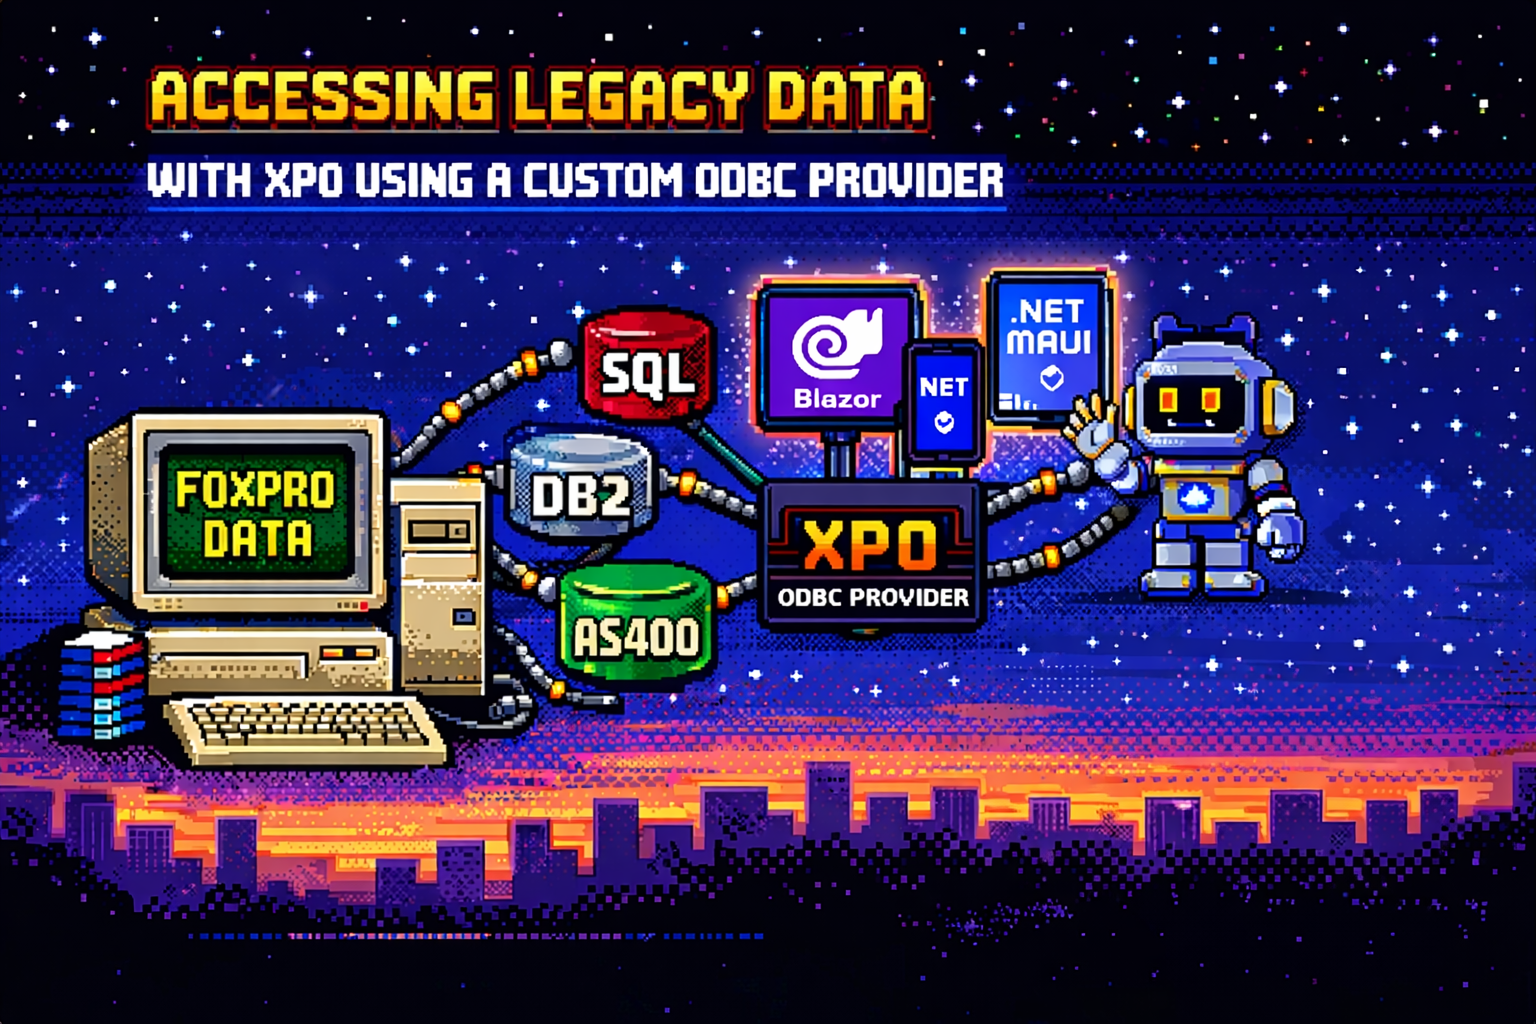
Accessing Legacy Data (Fox pro) with XPO Using a Custom ODBC Provider
Accessing legacy data doesn’t require rewriting old systems. This article explains how XPO and ODBC can be combined to integrate FoxPro, AS400, and DB2 databases into modern .NET architectures, enabling the use of Blazor, .NET MAUI, and even AI agents while respecting legacy dialects and type systems.
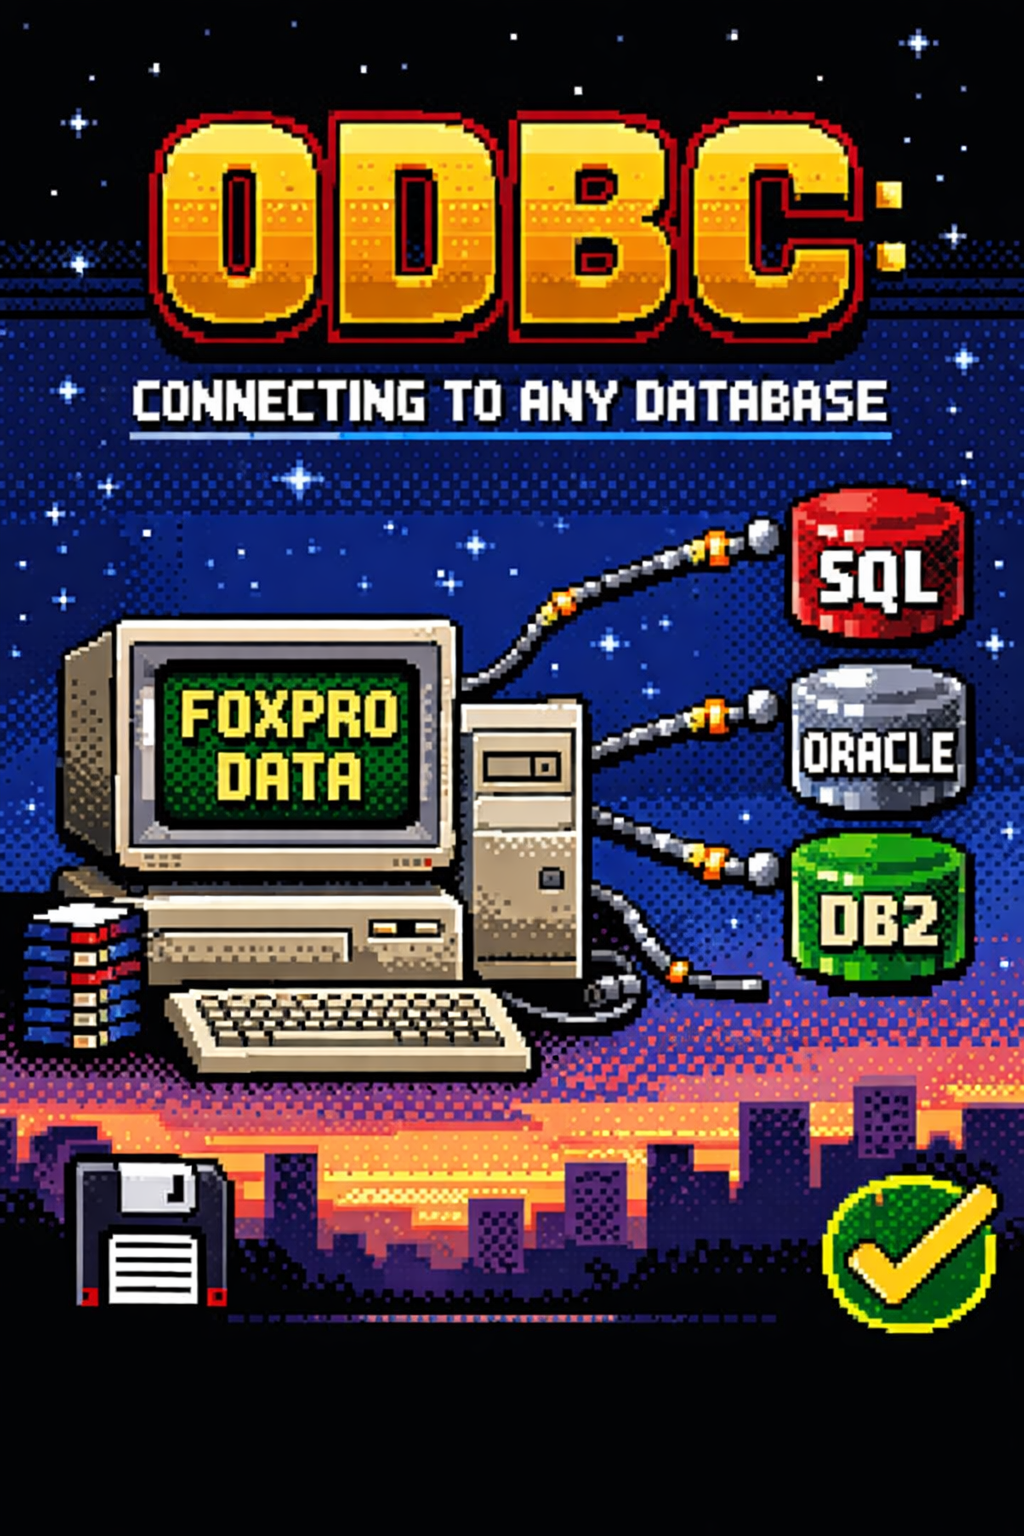
ODBC: A Standard That Was Never Truly Neutral
ODBC has been connecting applications to databases for decades. From FoxPro’s all-in-one world to modern .NET systems, this article explores what ODBC really is, why it still matters, and how it helps reduce database dependencies while improving portability and long-term maintainability in enterprise software.

Oqtane Event System — Hooking into the Framework
Learn how Oqtane’s event system works and how to hook into it using event subscribers. This guide covers user creation, login, and custom module events — with working C# examples and best practices for building reactive, event-driven modules.

Oqtane Silent Installation Guide
While working on Oqtane prototypes, I kept running into the setup wizard again and again — so I decided to automate the whole thing. This article shows how to configure a silent installation using the appsettings.json file, define default themes, containers, and templates, and save hours when spinning up new Oqtane sites for testing or deployment.

My Journey Exploring the Oqtane Framework
A developer’s field notes on learning Oqtane by reading source code, mapping lessons from XAF, and aiming for a single .NET codebase across client, server, and mobile—plus a personal update: I’m about to start learning Russian at the University of St. Petersburg.
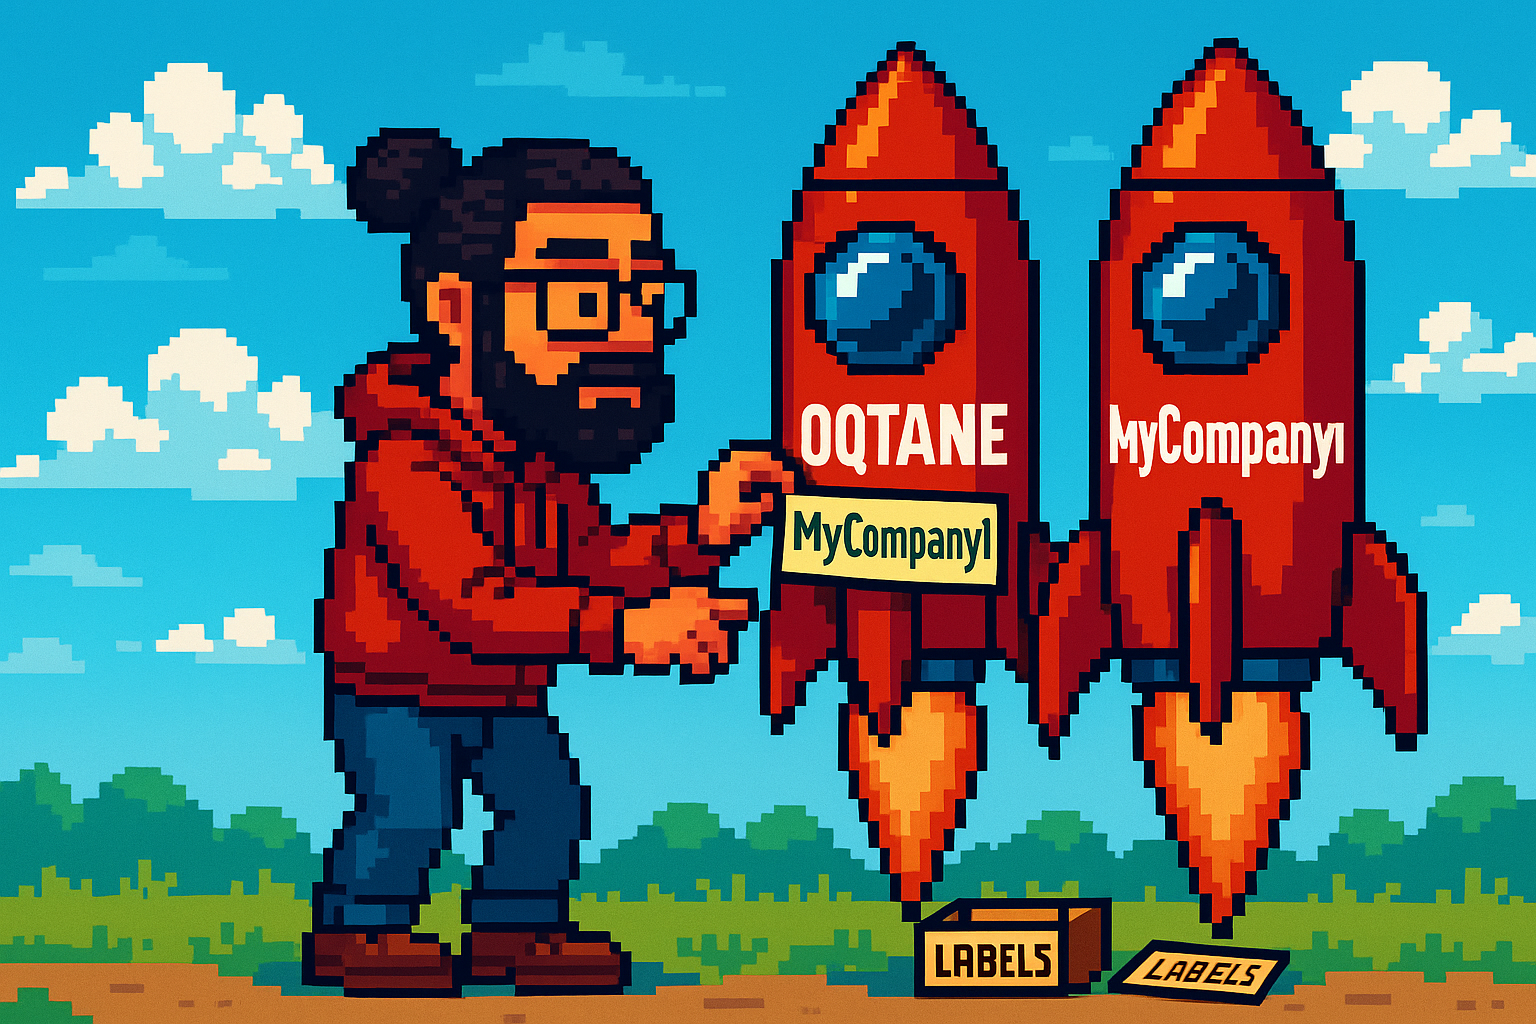
Setting Up Hostnames for Multi-Tenant Sites in Oqtane
Learn how to configure hostnames for multi-tenant sites in Oqtane using the Windows hosts file. This guide walks you through simulating local domains, routing tenants correctly, and understanding how DNS and web servers like Apache or Nginx handle requests — all explained with real examples and a bit of personal history.

Understanding Multi-Tenancy in Oqtane (and How to Set Up Sites)
Exploring how Oqtane handles multi-tenancy — setting up multiple sites within a single installation using SQLite, each with its own configuration, theme, and database options.
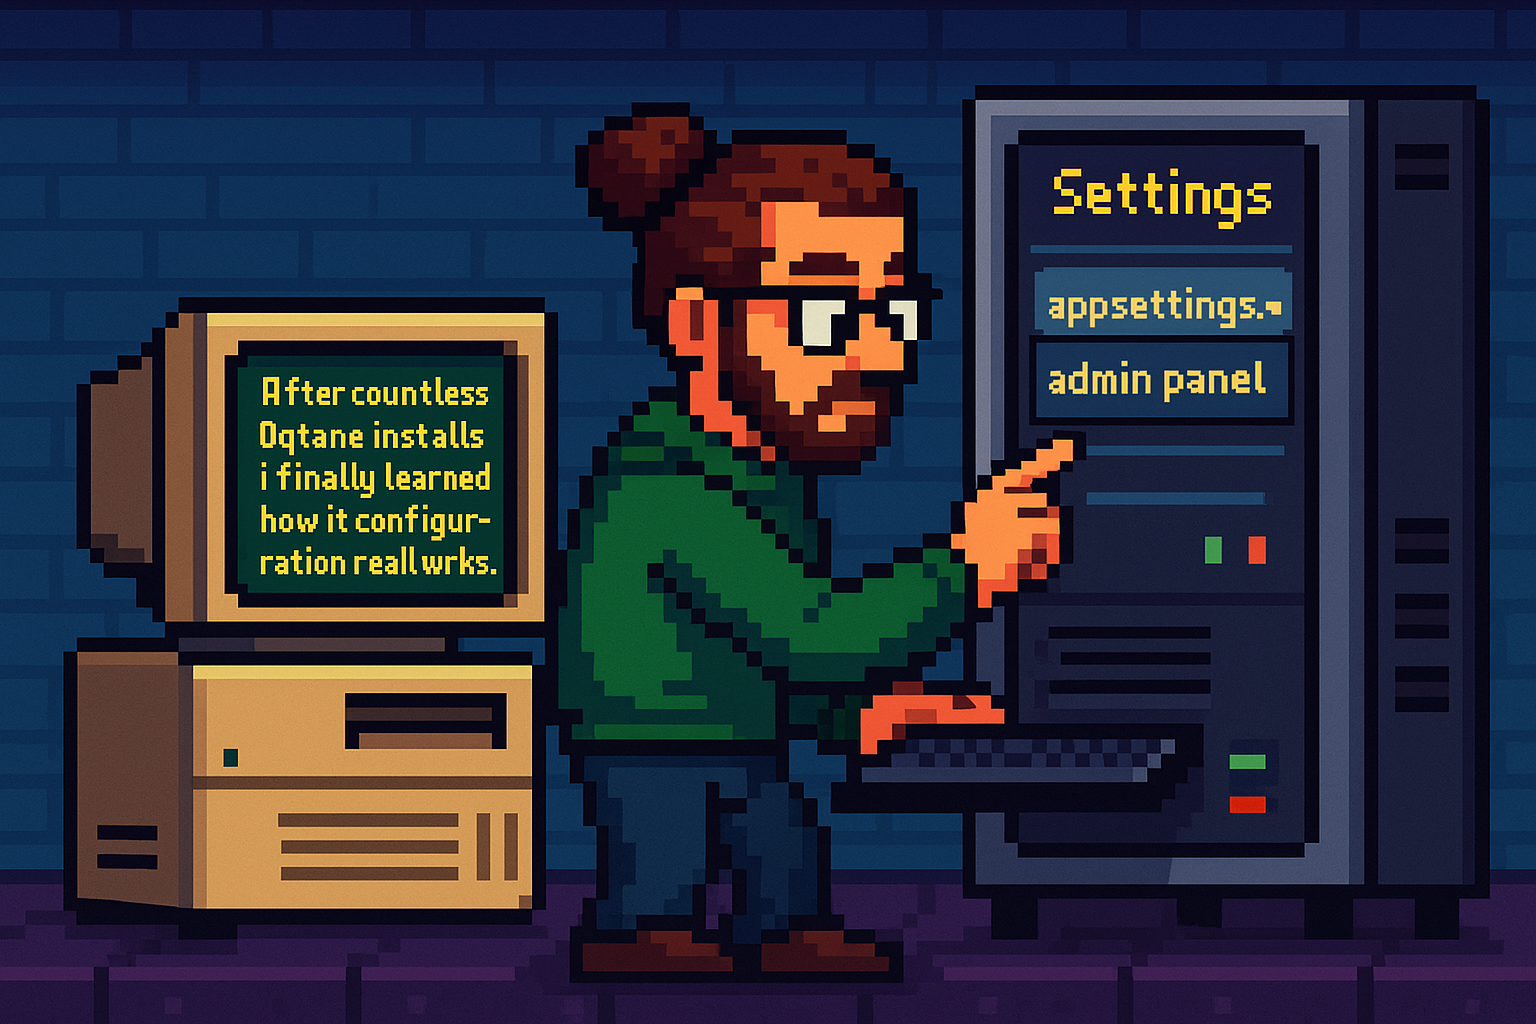
Oqtane Notes: Understanding Site Settings vs. App Settings for Hosting Models and Render Modes
After countless Oqtane installs, I finally learned how its configuration really works. The values in appsettings.json only apply when creating a new site — once it’s running, all runtime and render mode changes must be made from the admin panel. This post explains that subtle but important difference.
Setting Up Your Oqtane Database: First Run and Configuration
Learn how to set up your Oqtane database for the first time using either the built-in setup wizard or a manual configuration in appsettings.json. This guide walks you through each step to get your Oqtane installation running smoothly and ready for backend exploration in the next article.

Getting Started with Oqtane 6.2.x
Returning to Oqtane after some time away, I’m documenting my journey through this powerful .NET-based framework. As our office explores new development options that keep us close to the .NET ecosystem, Oqtane stands out as a compelling choice for production-sized projects. This first article in the series tackles the fundamental question every developer faces: how do you actually install and set up Oqtane? From cloning the GitHub repository to using the simplified .NET templates, I’ll walk you through two different approaches—each with its own advantages depending on your experience level and project goals. Whether you’re a beginner looking for the quickest path to productivity or an experienced developer wanting to understand the framework’s layered architecture, this guide provides the essential steps and insights to get you started with Oqtane development.

The Dangers (and Joys) of Vibe Coding
After a 4:30 a.m. coffee, I fell into a five-hour vibe-coding session that turned a small tweak into a full-blown app rewrite. This article reflects on the joy and danger of coding in flow, the lessons learned, and why sometimes you need a teammate to say, “It’s done.”
From Weasel to Sequel to “Speckified”: How Developers Twist Acronyms
Developers love twisting acronyms into funny nicknames. WSL becomes “weasel,” SQL turns into a “sequel robot,” and GitHub’s Spec Kit inspires the spooky word “speckified.” In English and Spanish, these pronunciations diverge, but the memes bring everyone together. Meet the weasel, the robot, and the wizard casting specs.
From Airport Chaos to Spec Clarity: How Writing Requirements Saved My Sanity
Ever tried vibe coding while traveling? Between airports, bad Wi-Fi, and half-baked prompts, I learned the hard way that AI doesn’t need more code—it needs better requirements. Thanks to GitHub’s Spec Kit and insights from James Montemagno and Frank Kruger on the Merge Conflict podcast, I discovered that the real magic isn’t in writing code—it’s in writing clarity. Humans reduce entropy. AI executes it.
From Vibe Coding to Vibe Documenting: How I Turned 6 Hours of Chaos into 8 Minutes of Clarity
Most programmers have fallen into the trap of “vibe coding”—throwing half-baked requirements at AI assistants and hoping for magic. I recently spent six hours vibe coding an Oqtane activity stream module, generating lots of code but making little real progress. Then I switched approaches. Instead of letting the AI guess, I documented exactly what I needed: module structure, display requirements, and integration points. The result? In eight minutes, I had a clean, working solution. The lesson is clear: AI is only as good as the clarity of its input. Humans reduce chaos; AI executes clarity.
DevExpress Documentations is now accessible as an MCP server
DevExpress users can now supercharge their GitHub Copilot experience with the new Documentation MCP server. Simply enable agent mode, create a .mcp.json configuration file, and add “Use dxdocs” to your prompts. This preview feature provides AI-powered access to DevExpress documentation, making XAF development faster and more intelligent than ever.
Understanding Keycloak: An Identity Management Solution for .NET Developers
Keycloak is an open-source Identity and Access Management solution that provides centralized authentication and Single Sign-On capabilities across multiple applications. For .NET developers, it offers seamless integration through standard protocols like OpenID Connect, eliminating authentication fatigue while providing cost-effective, vendor-independent identity management with extensive customization options for modern applications.
MailHog: The Essential Email Testing Tool for .NET Developers
MailHog is an essential open-source email testing tool that captures emails sent by your .NET applications instead of delivering them to real recipients. Perfect for testing authentication workflows, password resets, and user registration processes, MailHog provides a clean web interface to view and inspect captured emails in real-time. Easy to install on WSL using an automated script, it integrates seamlessly with System.Net.Mail and works as a drop-in replacement for production SMTP servers. With features like API access, message persistence, and failure testing, MailHog eliminates the risks and complexity of email testing during development.
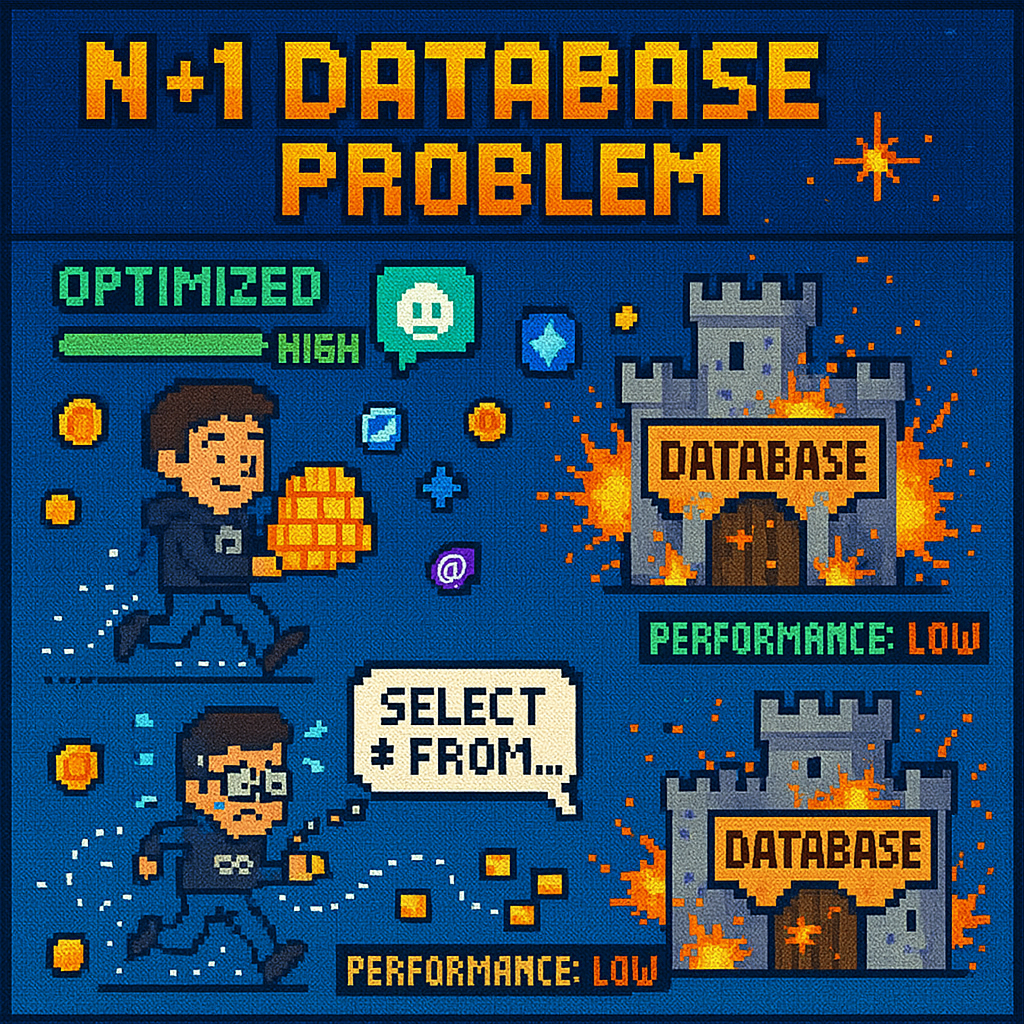
Understanding the N+1 Database Problem using Entity Framework Core
The N+1 database problem is a performance killer that silently destroys application speed. This comprehensive test suite demonstrates how innocent-looking code can generate hundreds of unnecessary database queries instead of one efficient query. Through 12 detailed test cases using Entity Framework Core, we explore the difference between problematic lazy loading approaches that create 4+ queries and optimized solutions using Include() that require just 1 query. Real examples show 75% performance improvements, with actual SQL output revealing what happens under the hood. Learn projection, eager loading, split queries, and batch loading patterns to build applications that stay fast as they scale.
Day 4 (the missing day): Building Data Import/Export Services for Your ERP System
In Day 4 of our ERP development series, we tackle a crucial but often overlooked feature: data import/export services. Learn how to build robust CSV import/export functionality for Chart of Accounts, including error handling, validation, and testing strategies that you can apply throughout your enterprise system.

Building a Comprehensive Accounting System Integration Test – Day 5
This article explores the implementation of a comprehensive integration test for an accounting system, demonstrating how Document and Chart of Accounts modules work together. Using a collection-based approach to simulate database interactions, the test validates double-entry accounting principles while ensuring proper transaction processing and balance verification across various business scenarios.

Understanding the Chart of Accounts Module: Day 3 – The Backbone of Financial Accounting Systems
The chart of accounts module forms the foundation of any accounting system, organizing financial transactions by categorizing accounts. A well-designed implementation includes entity definitions, type enumerations, validation logic, and balance calculation functionality—all working together to support accurate financial reporting while adhering to SOLID design principles.

Understanding the Document Module: Day 2 – The Foundation of a Financial Accounting System
The Document Module forms the foundation of financial accounting systems, organizing financial data into three interconnected components: Documents (the source records), Transactions (financial impacts), and Ledger Entries (account changes). This modular architecture ensures data integrity, maintains audit trails, supports compliance, and enables flexible integration of various financial processes.
Building an Agnostic ERP System: Day 1 – Core Architecture
Building an agnostic ERP system using SOLID design principles and C# 9 addresses recurring challenges in system design. The core architecture features foundational interfaces like IEntity, IAuditable, and IArchivable, creating a technology-independent foundation that maintains consistent performance while enabling reimplementation across various platforms like DevExpress XAF or Entity Framework.
The Anatomy of an Uno Platform Solution
Understanding the structure of an Uno Platform solution is essential for effective cross-platform development. This article examines the “black magic” behind Uno Platform’s architecture, breaking down the main components: the shared project containing cross-platform code, platform-specific head projects, and critical build configuration files. We explore the power of Uno.Sdk, which simplifies development with automatic package management through UnoFeatures, target framework specifications, and single-project configuration. By leveraging this structured approach, developers can maintain a single codebase targeting multiple platforms, dramatically reducing complexity while ensuring consistent experiences across Windows, iOS, Android, macOS, and WebAssembly.

Running Docker on a Windows Surface ARM64 Using WSL2
Discover how to install and run Docker Community Edition on a Microsoft Surface with ARM64 architecture using Windows Subsystem for Linux 2 (WSL2). This step-by-step guide walks you through the entire process, from preparing your WSL2 environment to verifying your Docker installation is working properly. Perfect for developers with ARM-based Windows devices looking to leverage containerization without compatibility headaches.
Testing SignalR Applications with Integration Tests
Testing SignalR chat applications requires a different approach than traditional API testing. By creating a test host server with a handler instead of an HTTP client, we can simulate real-world scenarios where messages are sent through SignalR hubs, allowing us to verify the complete set of moving parts
My Microsoft MVP Summit Experience
It’s been a week since the Microsoft MVP Summit. In Istanbul, I was lucky to rest in the airport’s business lounge before my 15-hour flight to Seattle. After overcoming arrival challenges, I enjoyed meaningful conversations with Jerome from Uno, Mads Kristensen, Jeremy Sinclair, and James Montemagno.

Getting Started with Uno Platform: First Steps and Configuration Choices
Discover the essentials of creating applications with Uno Platform. This guide walks you through the initial setup process, from project creation to configuration choices, helping you navigate framework selection, target platforms, presentation patterns, and more. Learn from my two-week journey and make informed decisions for your Uno Platform projects.

Connecting WASM Apps to APIs: Overcoming CORS Challenges
Connecting WebAssembly apps to APIs can be challenging due to CORS restrictions. After struggling with WCF services, I discovered that Uno Platform makes this integration surprisingly seamless. Understanding CORS is essential—it’s a security feature that controls cross-origin requests in browsers, requiring proper server configuration to enable WASM-to-API communication.

DNS and Virtual Hosting: A Personal Journey
Discover how DNS enables multiple websites to share a single IP address through virtual hosting. Learn from my journey from teenage networking experiments to professional server management, and see how the Windows hosts file can be your secret weapon for local development and troubleshooting without affecting live environments.

Troubleshooting MAUI Android HTTP Client Issues: Native vs Managed Implementation
When your MAUI Android app connects to public APIs but fails with internal network services, HTTP client implementation differences are often the culprit. By switching between native and managed HTTP clients and addressing certificate validation and TLS compatibility issues, you can identify and resolve these common networking challenges.
My Adventures Picking a UI Framework: Why I Chose Uno Platform
This year I challenged myself to learn UI development after years of back-end coding. After considering Flutter and React, I rediscovered Uno Platform. With improved tooling and seamless integration with my .NET expertise, Uno became my choice. I’ll document my journey creating multi-platform applications using this promising framework.
Visual Studio Sign-In Issues: A Simple Fix (Fixing visual studio sign in error Code: 3399680404 )
Frustrated with Visual Studio sign-in issues? Despite resetting my computer, I couldn’t change accounts until I discovered a simple fix. Navigate to Options > Environment > Accounts and change authentication from ‘Windows authentication broker’ to ‘Embedded web browser.’ This small adjustment solved my persistent problem and might work for you too!

Exploring the Uno Platform: Handling Unsafe Code in Multi-Target Applications
This weekend I experimented with the Uno platform, a multi-OS UI framework for developing mobile, desktop, web, and Linux applications from a single codebase. While Uno’s concept is excellent, its tooling previously had stability issues after Visual Studio updates. Surprisingly, I found setup now works effortlessly on both my ARM-based Surface laptop and x64 MSI computer. However, when compiling demo applications, I encountered issues with unsafe code generation. The solution involves uncommenting the true setting in the project file. This enables C# unsafe code blocks necessary for pointer operations, fixed statements, and direct memory manipulation required by some Uno platform components.

State Machines and Wizard Components: A Clean Implementation Approach
This article explores implementing wizard components using state machine architecture. By separating UI from logic, developers can create cleaner, more maintainable multi-step forms. The approach centralizes state control through a WizardStateMachineBase class that manages page transitions, significantly simplifying development challenges and creating extensible interfaces that enhance user experience by limiting decisions at each step.

Windows Server Setup Guide with PowerShell
Server scripting solutions for Windows 2016 setup: Streamline your Windows Server deployment with automation scripts that tackle common pain points. Learn how to efficiently disable IE Enhanced Security, install Web Server roles with Web Deploy, fix permission issues, set up SQL Server Express, and enable remote database access—all without endless UI clicking.

Setting Up WSL 2: My Development Environment Scripts
After a problematic Windows update on my Surface computer that prevented me from compiling .NET applications, I spent days trying various fixes without success. Eventually, I had to format my computer and start fresh. This meant setting up everything again – Visual Studio, testing databases, and all the other development tools.To make future setups easier, […]

Understanding System Abstractions for LLM Integration
Understanding how to integrate large language models with existing systems requires knowledge of different abstraction levels. From APIs and REST protocols to SDK implementations, developers must choose the appropriate interaction level for their automation needs. Whether using Microsoft Semantic Kernel or Model Context Protocol, the key is selecting the right integration approach for your system.

Bridging Traditional Development using XAF and AI: Training Sessions in Cairo
A transformative training session in Cairo demonstrated how modern application frameworks and AI can revolutionize business software development. By integrating DevExpress’s XAF with Microsoft Semantic Kernel, JavaScript developers discovered powerful alternatives to traditional web development approaches, bridging the gap between conventional LOB applications and AI-powered solutions.

Hard to Kill: Why Auto-Increment Primary Keys Can Make Data Sync Die Harder
Auto-increment primary keys, while popular among developers, can create significant challenges in data synchronization scenarios. Each database engine implements these differently – from SQL Server’s IDENTITY to PostgreSQL’s sequences – making cross-database coordination complex. Understanding these implementations is crucial when designing systems that require reliable data synchronization across distributed environments.

SyncFramework for XPO: Updated for .NET 8 & 9 and DevExpress 24.2.3!
SyncFramework for XPO is a specialized implementation of our delta encoding synchronization library, designed specifically for DevExpress XPO users. It enables efficient data synchronization by tracking and transmitting only the changes between data versions, optimizing both bandwidth usage and processing time. What’s New Base target framework updated to .NET 8.0 Added compatibility with .NET 9.0 […]
SyncFramework Update: Now Supporting .NET 9 and EfCore 9!
SyncFramework Update: Now Supporting .NET 9! SyncFramework is a C# library that simplifies data synchronization using delta encoding technology. Instead of transferring entire datasets, it efficiently synchronizes by tracking and transmitting only the changes between data versions, significantly reducing bandwidth and processing overhead. What’s New All packages now target .NET 9 BIT.Data.Sync packages updated to […]

Say my name: The Evolution of Shared Libraries
From VB6’s COM components to .NET’s GAC and today’s private dependencies, the evolution of shared libraries reflects the changing landscape of software development. In my early career, we faced “DLL Hell” when shared components in Windows System directories would conflict or break multiple applications. The .NET Framework introduced the Global Assembly Cache with unique assembly identities, allowing multiple versions to coexist. Today, with storage being abundant, we’ve moved towards shipping applications with their own private dependencies. This journey shows how solutions evolve not just technically, but in response to real-world problems and changing resources

ADOMD.NET: Beyond Rows and Columns – The Multidimensional Evolution of ADO.NET
When I first encountered the challenge of migrating hundreds of Visual Basic 6 reports to .NET, I discovered the power of specialized data analytics tools through ADOMD.NET. The journey began with a seemingly simple “Sales Gap” report that identified periods when regular customers stopped purchasing specific items. As our data grew, the report’s execution time increased from one minute to an unbearable 15 minutes. While we couldn’t implement ADOMD.NET due to database constraints, the investigation taught valuable lessons about choosing the right tools for analytical workloads and understanding the limitations of running complex analytics on transactional databases.

Back to the Future of Dev Tools: DevExpress CLI templates
Technology, like fashion, moves in cycles. Just as bell-bottoms and vinyl records make their comebacks, we’re witnessing a fascinating return to command-line interfaces in software development. While the industry once raced towards graphical interfaces, developers are now embracing CLI tools with renewed enthusiasm. This shift is particularly evident in modern application templates, where DevExpress and others are creating cross-platform solutions that blend the best of both worlds. Through the lens of project templates and development tools, we explore how technology’s future often leads us back to its past.
The Dark Magic of Dynamic Assemblies: A Tale of .NET Emit
Explore the arcane world of runtime code generation in .NET through the lens of a real-world challenge. Journey back to the early 2000s when a seemingly simple task of parsing ERP documentation led to the discovery of Emit – one of .NET’s most powerful and mysterious features. Learn how this fundamental building block of dynamic assembly generation can be both a powerful ally and a dangerous tool in your development arsenal. From legacy system integration to modern alternatives like Source Generators, discover why understanding Emit remains crucial for developers who dare to venture beyond the conventional boundaries of .NET programming.
The Dark Arts of Self-Writing Code: A Journey from DOS to .NET Sorcery
In “The Dark Arts of Self-Writing Code: A Journey from DOS to .NET Sorcery,” the author recounts an inspiring journey from childhood fascination with MS-DOS commands to mastering metaprogramming in .NET. The narrative begins with humble experiments in AUTOEXEC.BAT scripts and evolves through explorations of languages like Turbo Pascal, C++, and C#. The author shares transformative moments, such as learning reflection—a form of “code magic” that enables runtime introspection and modification. Along the way, practical lessons are imparted: cache operations, guard sensitive data, and balance performance costs. Ultimately, the tale emphasizes the power of curiosity and continuous learning in programming mastery.
The Dark Magic of .NET: Exploring Harmony Library in 2025
Explore the dark magic of .NET with Harmony, a powerful library that transforms runtime method patching in C# applications. At Xari, where we tackle everything from LOB applications to AI systems, Harmony has become an invaluable tool in our development arsenal. This sophisticated library offers three powerful approaches to code modification: Prefix patches for pre-execution intervention, Postfix patches for result manipulation, and Transpilers for direct IL code modification. While it might seem like dark magic, Harmony is really about understanding and leveraging .NET’s architecture to achieve what seems impossible, from performance monitoring to legacy system enhancement.
The AnyCPU Illusion: Native Dependencies in .NET Applications
This article explores the limitations of the AnyCPU configuration in .NET applications, particularly when dealing with native dependencies. The author shares a personal story about a realization during a trip, highlighting the challenges of running x64 applications on ARM-based systems like Apple Silicon. The narrative transitions into technical insights about native DLL loading requirements and architecture-specific considerations. It emphasizes the importance of native driver compatibility for ORMs like Entity Framework Core and DevExpress XPO. Solutions such as architecture-specific deployments and managed fallbacks are proposed, making it clear that AnyCPU is not a universal solution for cross-platform development.
Exploring .NET 9’s Sequential GUIDs: A Game-Changer for XAF/XPO Developers
Exploring .NET 9’s latest features reveals an exciting addition for XAF/XPO developers: Version 7 GUIDs (RFC 9562 specification). This new implementation solves a common challenge with traditional GUIDs – their non-sequential nature. Through practical experience with the SyncFramework, where Delta processing order proved problematic due to unpredictable GUID sorting, the need for sortable identifiers became evident. .NET 9’s CreateVersion7() method now generates sequential GUIDs, eliminating the need for custom sequence services. This feature significantly simplifies scenarios requiring reliable ordering, making it a valuable tool for developers working with distributed systems and synchronization frameworks.
Understanding XtraReports: A Windows Forms Developer’s Guide
ransitioning from Windows Forms to XtraReports can be a seamless journey for .NET developers. Leveraging familiar concepts like control containers, event handling, and data binding, XtraReports reimagines Windows Forms for robust reporting needs. My journey began in the early 2000s, evolving from VB6 with Crystal Reports to adopting DevExpress tools. This article explores the architectural parallels, design experience, and best practices to master XtraReports, guiding developers to efficiently design paper-oriented layouts with features like bands, expression bindings, and calculated fields. Discover how your existing expertise can accelerate understanding and productivity in creating professional reports.
Guide to Blazor Component Design and Implementation for backend devs
Blazor offers a modern, versatile approach to UI development for .NET developers, bridging the gap between web and desktop applications. As a seasoned .NET developer, I’ve explored platforms like Windows Forms, WPF, Xamarin, and MAUI, but Blazor stands out for its flexibility and broad applicability. From backend-focused frameworks like XAF to crafting custom NuGet libraries, my journey highlights the evolution of .NET development and the growing need for robust, reusable UI components. This guide shares key insights and practical lessons learned while building Blazor components, helping backend developers embrace frontend challenges with effective design patterns and streamlined implementation strategies.
Head Content Injection in .NET 8 Blazor Web Apps
With the release of .NET 8, Blazor introduced a significant change in how developers manage head content injection in web applications. The new unified template replaces the traditional _Host.cshtml approach with App.razor, introducing the HeadOutlet component for head content management. This shift offers two main approaches: adapting existing Tag Helpers to target HeadOutlet, or using a more idiomatic component-based solution with HeadContent. While both methods are viable, the component approach provides better integration with Blazor’s architecture, offering improved render mode support, dynamic content capabilities, and type safety for modern web applications.
Using DevExpress Chat Component and Semantic Kernel ResponseFormat to show a product carousel
On a snowy Saturday, I decided to explore a Blazor project using DevExpress Chat Component and Semantic Kernel. This setup allows us to display product lists as carousels in chat, leveraging AI to dynamically format responses in JSON. Check out how prompt execution settings ensure seamless, adaptable LLM responses
Async Code Execution in XAF Actions
Async execution in XAF can be challenging, especially in keeping the UI responsive. This article covers approaches like using async actions, potential pitfalls, and a solution with an AsyncBackgroundWorker for better UI interaction. Complete code examples are available on GitHub for detailed exploration and implementation
Querying Semantic Memory with XAF and the DevExpress Chat Component
Explore how to integrate DevExpress’s new chat component with XAF and Semantic Kernel. This post walks through creating a custom property editor, using XPO for Semantic Memory storage, and handling message callbacks. Learn how to store and query memories to enhance your AI-driven applications with ease.
Rewriting the XPO Semantic Kernel Memory Store to be Compatible with XAF
This article explores the process of adapting the XPO memory store to work with XAF by rewriting its data layer and making it more flexible for handling embeddings. It introduces the IXpoEntryManager interface to enhance object creation and querying while ensuring compatibility with XAF’s architecture.
AI-Powered XtraReports in XAF: Unlocking DevExpress Enhancements
This blog post explores how to integrate AI-powered enhancements into DevExpress Reporting using Blazor. It walks through the setup process, including NuGet package references and configuring AI behavior for XtraReport. With easy-to-follow steps and code snippets, you’ll learn how to leverage AI features like summarization in your reports effortlessly.
The New Era of Smart Editors: Creating a RAG system using XAF and the new Blazor chat component
This article explores the integration of AI-powered chat functionality into XAF applications using the new DevExpress components. It guides developers through creating a custom property editor, utilizing Retrieval-Augmented Generation (RAG) for enhanced document analysis, and demonstrates how to bridge XAF and Blazor for seamless AI integration in .NET applications.
Integrating DevExpress Chat Component with Semantic Kernel: A Step-by-Step Guide
Integrating DevExpress’s chat component with the Semantic Kernel for AI-powered chat completions is a game-changer. This step-by-step guide shows how to set up an intelligent chat interface using OpenAI and .NET. Learn how to combine these technologies and bring dynamic, context-aware conversations into your applications effortlessly!

Test Driving DevExpress Chat Component
If you’re a Blazor developer looking to integrate AI-powered chat functionality into your applications, the new DevExpress DxAIChat component offers a turnkey solution. It’s designed to make building chat interfaces as easy as possible, with out-of-the-box support for simple chats, virtual assistants, and even Retrieval-Augmented Generation (RAG) scenarios. The best part? You don’t have to […]

Using the IMemoryStore Interface and DevExpress XPO ORM to Implement a Custom Memory Store for Semantic Kernel
This article demonstrates how to implement a custom memory store in Semantic Kernel using the IMemoryStore interface and DevExpress XPO ORM. By leveraging XPO’s database abstraction, you can easily manage AI-driven memory records across multiple databases, ensuring flexibility and scalability for your AI applications in .NET environments.
Leveraging Memory in Semantic Kernel: The Role of Microsoft.SemanticKernel.Memory Namespace
This article explores the **Microsoft.SemanticKernel.Memory Namespace**, focusing on the **VolatileMemoryStore** and how any class implementing **IMemoryStore** can serve as a memory backend for **SemanticTextMemory**. It highlights the flexibility of the memory system in Semantic Kernel for integrating custom memory stores, enhancing AI-driven applications.
Memory Types in Semantic Kernel
Semantic Kernel simplifies integrating AI models into your applications, with chat completions being the most common interaction method. Temporary memory, managed by the ChatHistory object or a string argument, is lost once the host class is disposed. In the next article, we’ll explore long-term memory options for more persistent solutions.
Understanding Shadow Sockets and How They Differ from Traditional VPNs
Shadow Sockets (Shadowsocks) is an open-source encrypted proxy project created to bypass internet censorship, particularly the Great Firewall of China. Unlike traditional VPNs, Shadowsocks uses the SOCKS5 protocol, making it less detectable and more efficient. Developed by “clowwindy” in 2012, Shadowsocks has evolved through community contributions. It offers better performance and lower latency compared to VPNs, making it ideal for high-censorship environments. While VPNs provide comprehensive security and ease of use, Shadowsocks excels in evading detection and maintaining a lightweight connection, making it a valuable tool for accessing unrestricted internet content.
Creating XAF Property Editors in a Unified Way for Windows Forms and Blazor Using WebView
The eXpressApp Framework (XAF) from DevExpress supports multiple UI platforms like Windows Forms and Blazor. This article demonstrates how to create unified property editors for both platforms using WebView and the Monaco Editor. By leveraging these tools, developers can streamline maintenance and ensure a consistent user experience across platforms. Key steps include setting up a new XAF solution, creating a Razor Class Library, integrating it into Windows Forms, and implementing XAF property editors. The result is a versatile application with powerful property editors, enhancing the development process and user interface cohesion.

The Critical Need for AI Legislation in El Salvador: Ensuring Ethical and Innovative Growth
El Salvador is on the brink of a technological revolution with its ambitious plans to integrate Artificial Intelligence (AI) across various sectors. To harness AI’s full potential while mitigating risks, the country urgently needs a comprehensive AI legal framework. This legislation will ensure ethical standards, data protection, innovation incentives, workforce transition programs, and international cooperation. Establishing such a framework will position El Salvador as a leader in AI innovation, driving economic growth and enhancing public services, while safeguarding citizens’ rights and promoting equitable treatment in the digital age.

El Salvador: Digital Transformation Initiatives
El Salvador is undergoing a remarkable digital transformation under President Nayib Bukele, driven by strategic partnerships with tech giants like Google. This includes advancements in healthcare, education, and digital government services. The government has invested significantly in digital infrastructure, expanding internet access and implementing 5G technology. The introduction of the Chivo Wallet has promoted cashless transactions and financial inclusion. Efforts to improve digital literacy are widespread, targeting the general public, students, and government employees. These initiatives aim to position El Salvador as a leader in digital innovation within Latin America.

El Salvador: The Implementation of Bitcoin as Legal Tender
El Salvador made global headlines on June 9, 2021, by becoming the first country to adopt Bitcoin as legal tender. This unprecedented move, spearheaded by President Nayib Bukele, aimed to modernize the economy and increase financial inclusion. The implementation included the launch of the Chivo Wallet and Bitcoin ATMs, along with significant government investments. While the initiative sparked international interest and boosted tourism, it also faced skepticism due to Bitcoin’s volatility. This article explores the economic and social impacts of this bold experiment, highlighting both the opportunities and challenges of integrating cryptocurrency into a national economy.

El Salvador’s Technological Revolution
El Salvador has recently become a focal point for technological innovation under President Nayib Bukele. Born in Suchitoto during the civil war, I have observed this transformation from afar as a digital nomad living in Saint Petersburg, Russia. This article, the first in a series, explores how blockchain technology, financial services, and AI can drive growth in small countries like El Salvador. El Salvador has traditionally faced economic challenges such as poverty, gang violence, and a reliance on remittances. President Bukele’s administration has prioritized technological innovation to address these issues. A significant move was the adoption of Bitcoin as legal tender in 2021, aimed at promoting financial inclusion, reducing remittance costs, and attracting foreign investment. The government has also partnered with tech giants like Google to modernize its digital infrastructure, improve healthcare through telemedicine, and enhance education with AI tools. Bukele’s broader strategy involves shifting the economy from agriculture to technology, financial services, and tourism to create a more resilient and diverse economic base. This series will delve deeper into these initiatives, examining their impact and future prospects, and propose potential AI legislation to ensure continued leadership in technology within Latin America.

Embrace the Dogfood: How Dogfooding Can Transform Your Software Development Process
Dogfooding, or using your own software internally, can transform your development process. By experiencing your product firsthand, you catch bugs early, enhance quality, and improve user experience. Real-world usage provides immediate feedback, speeding up iteration and refining features. Companies like Microsoft, Google, and Slack use this practice to ensure reliability and build credibility. Start by integrating your software into daily tasks, encourage team participation, and set up easy feedback channels. Despite challenges like bias and resource allocation, dogfooding offers invaluable insights, leading to better, more trustworthy software. Embrace dogfooding and create products you truly rely on. Happy coding!
Aristotle’s “Organon” and Object-Oriented Programming
Discover the timeless connection between Aristotle’s “Organon” and Object-Oriented Programming (OOP). Aristotle, the ancient Greek philosopher, revolutionized logical thought with his systematic approach in the “Organon,” a collection of works on categories, propositions, and syllogisms. Fast forward to modern software development, OOP organizes code into classes, objects, and methods, promoting modularity and efficiency. Both systems emphasize structured, logical thinking and error handling. By bridging these ancient and modern principles, we gain a deeper appreciation for the enduring power of logical organization in both philosophical inquiry and technological innovation.

The mystery of lost values: Understanding ASCII vs. UTF-8 in Database Queries
When dealing with databases, understanding character encodings like ASCII and UTF-8 is crucial. ASCII uses 7 bits for each character, allowing 128 unique symbols, while UTF-8 is a variable-width encoding that can represent over a million characters. This difference impacts case-sensitive queries. For example, querying usernames from ‘A’ to ‘z’ includes all uppercase and lowercase letters and some special characters in ASCII. Understanding these ranges ensures accurate and efficient queries.
The Shift Towards Object Identifiers (OIDs):Why Compound Keys in Database Tables Are No Longer Valid
Compound keys in database tables, once essential for normalization, may no longer be ideal. They complicate design and maintenance, especially when tied to business logic. Object identifiers (OIDs) offer a simpler alternative, enhancing schema flexibility and performance. Modern storage solutions reduce the need for strict normalization, allowing a balanced approach. Many ORMs, like XPO from DevExpress, prefer OIDs for easier database interaction and compatibility with object-oriented programming. Simplifying schemas with OIDs can improve maintainability, performance, and decouple business logic, making database systems more robust and efficient.
Getting Started with Stratis Blockchain Development Quest: Running Your First Stratis Node
Stratis is a flexible blockchain platform built on C# and .NET. This guide helps you start developing by running a Stratis node. It covers installing .NET Core SDK, cloning the Stratis Full Node repository, building, and running the node to synchronize with the network, providing a foundation for your blockchain development.

Discovering the Simplicity of C# in Blockchain Development with Stratis
Discover how transitioning from Solidity to Stratis simplified my blockchain development journey. Stratis supports smart contracts using C#, making development more accessible and efficient. Learn about the challenges with Solidity, the benefits of Stratis, and the tools needed to start developing smart contracts in a familiar C# environment.

Solid Nirvana: The Ephemeral State of SOLID Code
Achieving a SOLID state in code is like reaching nirvana — a fleeting moment of perfection. Regularly measuring adherence to SOLID principles using metrics can guide continuous improvement. Embrace these temporary snapshots of perfection to maintain a balanced perspective in the ever-evolving journey of software development.
Choosing the Right JSON Serializer for SyncFramework
Choosing the right JSON serializer for SyncFramework is crucial for performance and data integrity. This article compares DataContractJsonSerializer, Newtonsoft.Json, and System.Text.Json, highlighting their features, use cases, and handling of DataContract requirements to help you make an informed decision for efficient synchronization in .NET applications.

Why I Use Strings as the Return Type in the SyncFramework Server API
Choosing strings as the return type in my SynFramework server API enhances performance, flexibility, and control over data serialization. This approach optimizes data transmission, ensures compatibility with various clients, and simplifies managing data formats, offering a robust solution for C# and Web API developers.

Remote Exception Handling in SyncFramework
Explore exception handling in SyncFramework’s client-server architecture. Learn about throwing exceptions in the API and returning HTTP status codes. Discover best practices for handling exceptions server-side, interpreting HTTP status codes, and crafting error messages without exposing sensitive information. Create robust, user-friendly applications with effective exception handling

To be, or not to be: Writing Reusable Tests for SyncFramework Interfaces in C#
Ensuring robust database synchronization, SyncFramework’s interfaces like IDeltaStore require thorough testing. By creating reusable base test classes and implementing concrete test classes, you ensure consistent behavior across all implementations. Automate these tests in your CI/CD pipeline for reliable, maintainable, and interchangeable components within your framework.

Breaking Solid: Challenges of Adding New Functionality to the Sync Framework
Introducing new functionality to a sync framework often challenges adherence to SOLID design principles. Each principle, from Single Responsibility to Dependency Inversion, presents specific dilemmas. For instance, adding new features can violate the Open/Closed Principle by necessitating modifications to existing code. Developers must strategically decide when to introduce breaking changes, considering factors like impact assessment, semantic versioning, and stakeholder engagement. Balancing innovation with design integrity requires thoughtful planning and robust testing practices. Ultimately, evolving the framework to meet user needs may sometimes mean bending established principles for greater functionality and efficiency.
Extending Interfaces in the Sync Framework: Best Practices and Trade-offs
In modern software development, extending interfaces like IDeltaStore and IDeltaProcessor in the Sync Framework to add events such as SavingDelta, SavedDelta, ProcessingDelta, and ProcessedDelta can enhance functionality but poses challenges. Extending existing interfaces is simpler but can break existing implementations and violate SOLID principles. Alternatively, adding new interfaces preserves backward compatibility and adheres to best practices, though it may introduce complexity and redundancy. Balancing these trade-offs is crucial. For maintaining backward compatibility and adhering to SOLID principles, adding new interfaces is preferred. However, extending interfaces might be viable in controlled environments with manageable updates.

Unlocking the Power of Augmented Data Models: Enhance Analytics and AI Integration for Better Insights
Discover the power of augmented data models, which extend traditional data models by integrating diverse data sources, advanced analytics, AI-driven embeddings, and enhanced data features. These models offer comprehensive insights, improved decision-making, and innovative capabilities, transforming how organizations leverage data for strategic advantage and operational efficiency.
The Transition from x86 to x64 in Windows: A Detailed Overview
he transition from x86 (32-bit) to x64 (64-bit) architecture in Windows marked a significant leap in computing capabilities. Introduced in the early 2000s, this shift allowed for better performance, enhanced security, and the ability to utilize more memory. To manage compatibility, Windows implemented separate directories for 32-bit (Program Files (x86)) and 64-bit (Program Files) applications. This change brought some confusion, particularly regarding program file structures and compatibility issues. Understanding these distinctions is crucial for optimizing system performance and navigating the modern computing landscape effectively.
Understanding CPU Translation Layers: ARM to x86/x64 for Windows, macOS, and Linux
As technology evolves, running software across different CPU architectures has become crucial. CPU translation layers enable ARM-compiled applications to run on x86/x64 platforms seamlessly. Windows uses WOW and x86/x64 emulation, macOS employs Rosetta 2, and Linux leverages QEMU for this purpose. These layers translate instructions dynamically, often using Just-In-Time (JIT) compilation and caching techniques to optimize performance. Developers are encouraged to compile for multiple architectures and thoroughly test their applications. CPU translation layers ensure compatibility and smooth interoperability, bridging the gap between ARM and x86/x64 across Windows, macOS, and Linux.

How ARM, x86, and Itanium Architectures Affect .NET Developers
Understanding how ARM, x86, and Itanium architectures impact .NET development is crucial for optimizing performance and ensuring compatibility. ARM’s energy efficiency benefits mobile devices, while x86 excels in high-performance tasks. Itanium, designed for high-end computing, requires unique optimization strategies. .NET supports various architectures, including x86, ARM, and limited Itanium. Developers must use appropriate NuGet packages—either architecture-agnostic or specific—to maintain performance and compatibility. By leveraging cross-platform capabilities, using the right packages, and thorough testing, developers can create efficient applications for diverse devices. This article explores these architectures’ effects on .NET development, highlighting essential strategies and tools.
Understanding CPU Architectures: ARM vs. x86
Explore the key differences between ARM and x86 CPU architectures. ARM, known for its power efficiency and scalability, dominates mobile and embedded markets. In contrast, x86 excels in high-performance computing for desktops and servers, with a rich software ecosystem. Discover why x86 remains essential for running legacy and specialized software, particularly in high-end gaming and professional applications.

A New Era of Computing: AI-Powered Devices Over Form Factor Innovations
of AI with its Neural Processing Unit (NPU). This shift emphasizes enhancing existing devices with AI over creating new form factors. The Surface’s NPU enables real-time local processing, boosting productivity, personalization, and security by reducing reliance on cloud services. Unlike devices like the Humane Pin and Rabbit AI, which depend heavily on cloud connectivity, the Surface’s local AI processing offers faster and more secure performance. This innovation sets a new standard for future tech advancements.
Comparing OpenAI’s ChatGPT and Microsoft’s Copilot mobile apps
OpenAI’s ChatGPT and Microsoft’s Copilot are two powerful AI tools that have revolutionized the way we interact with technology. While both are designed to assist users in various tasks, they each have unique features that set them apart. OpenAI’s ChatGPT ChatGPT, developed by OpenAI, is a large language model chatbot capable of communicating with users […]

Embracing the WSL: A DotNet Developer’s Perspective
Exploring WSL for .NET Developers: Discover the benefits of Windows Subsystem for Linux (WSL) for .NET development. Enhance your workflow with Linux’s powerful features while leveraging the robust .NET ecosystem. Dive into a seamless integration that boosts productivity and broadens your development capabilities
New version of SyncFramework for Efcore 8.0.0.X
I’m happy to announce the new version of SyncFramework for EfCore, targeting net8.0 and referencing EfCore 8 nugets as follow EfCore Postgres Version: 8.0.4 EfCore PomeloMysql Version: 8.0.2 EfCore Sqlite Version: 8.0.5 EfCore SqlServer Version: 8.0.5 You can download the new versions from Nuget.org and check the repo here Happy synchronization everyone!!!!

Design Patterns for Library Creators in Dotnet
Explore the world of design patterns with a focus on SOLID principles in .NET library creation. Using the SyncFramework as an example, we delve into how these principles lead to more understandable, flexible, and maintainable software. Stay tuned for real-world examples in our upcoming series.

Semantic Kernel Connectors and Plugins
Welcome to the fascinating world of artificial intelligence (AI)! You’ve probably heard about AI’s incredible potential to transform our lives, from smart assistants in our homes to self-driving cars. But have you ever wondered how all these intelligent systems communicate and work together? That’s where something called “Semantic Kernel Connectors” comes in. Imagine you’re organizing […]
Semantic Kernel: Your Friendly AI Sidekick for Unleashing Creativity
Explore the power of AI with Microsoft’s Semantic Kernel.

Unlocking the Magic of IPFS Gateways: Your Bridge to a Decentralized Web
IPFS gateways serve as cosmic bridges, connecting our familiar HTTP web to the decentralized wonderland of IPFS. Imagine fetching content from the stars and translating it into earthly language—these gateways do just that. Whether you’re sharing interstellar recipes or marveling at celestial cat memes, IPFS gateways make the cosmos accessible to all.

Mastering Symbolic Links: Unleashing the Power of Symlinks for Efficient File Management
Explore the concept of symbolic links, or symlinks, in file systems. Learn about soft and hard links, their uses, and how to create them in Windows. Discover how symlinks can manage storage by moving large files, like LLM files, to an external drive while maintaining accessibility.

A Beginner’s Guide to System.Security.SecurityRules and SecuritySafeCritical in C#
Explore the critical security attributes in .NET Framework – `System.Security.SecurityRules` and `SecuritySafeCritical`. Understand their roles, relationship, and usage in enforcing Code Access Security. Learn about trusted code and see practical examples of these attributes in action. Remember, with great power comes great responsibility!

An Introduction to Dynamic Proxies and Their Application in ORM Libraries with Castle.Core
This article provides an introduction to Castle.Core and dynamic proxies, focusing on their application in Object-Relational Mapping (ORM) Libraries. It explains how Castle.Core, a popular open-source project, offers common abstractions and has been downloaded over 88 million times. The article simplifies the concept of dynamic proxies and highlights their significance in intercepting method calls and implementing aspect-oriented programming. It also presents a simple example of creating a dynamic proxy using Castle.Core. The article concludes by emphasizing the utility of Castle.Core and dynamic proxies in enhancing programming capabilities, especially in ORM libraries.

Understanding Non-Fungible Tokens (NFTs)
This article provides an in-depth understanding of Non-Fungible Tokens (NFTs), their representation, the role of smart contracts in minting NFTs, and the difference between fungible and non-fungible tokens. It also highlights the use of OpenZeppelin contracts in the NFT space.

Finding Out the Invoking Methods in .NET
Finding Out the Invoking Methods in .NET In .NET, it’s possible to find out the methods that are invoking a specific method. This can be particularly useful when you don’t have the source code available. One way to achieve this is by throwing an exception and examining the call stack. Here’s how you can do […]

Blockchain in Healthcare: A Revolution in Medical Records Management
Blockchain technology, particularly Ethereum-like blockchains, can revolutionize the healthcare industry by providing a secure and organized exchange of data within the medical community. This technology offers a secure, decentralized, and transparent platform that can address many of the pressing issues in healthcare, such as fragmented and siloed records, and difficult access to patients’ own health information.

Using Blockchain for Carbon Credit Sales
Blockchain and Carbon Credits Innovative Approach: The article discusses the utilization of blockchain technology to facilitate the sale of carbon credits. Technical Insights: It provides an overview of the process and the benefits of using blockchain for such transactions. Practical Examples: The content includes real-world applications and case studies to illustrate the concept. Expert Analysis: The piece offers expert opinions and analysis on the potential impact of blockchain on the carbon credit market.

Understanding OpenVPN and DD-WRT
In today’s digital age, ensuring the security of our online activities and expanding the capabilities of our home networks are more important than ever. Two powerful tools that can help you achieve these goals are OpenVPN and DD-WRT. Here’s a straightforward guide to understanding what these technologies are and how they can be beneficial. What […]

Understanding Ethereum, Smart Contracts, and Blockchain Comparisons
The Ethereum Virtual Machine (EVM) acts as a decentralized global computer, made up of thousands of individual computers around the world. This network supports smart contracts—self-executing contracts with the terms directly written into code, eliminating the need for intermediaries. Smart contracts enable automated, secure, and efficient transactions, such as automatic rent payments from a tenant to a landlord. Beyond Ethereum, other blockchains like Solana, Polygon, and TON (The Open Network) also support smart contracts, each offering distinct advantages. Solana is renowned for its exceptional processing speed and low transaction costs, making it highly scalable and cost-effective for operations. Polygon enhances Ethereum by providing faster and cheaper transaction capabilities on its side-chain, significantly improving the transaction processing time and reducing costs. TON is designed to be fast and efficient, supports a variety of features including decentralized storage, and aims to make blockchain technology accessible to the mainstream market. These blockchains enhance user experience through faster transactions, lower costs, and high scalability. They also ensure security and reliability due to their decentralized nature. Each platform caters to different needs, allowing developers to select the most suitable blockchain based on their specific requirements for efficiency and functionality. The choice of blockchain can profoundly impact the efficiency, cost, and scalability of applications, making it crucial for developers to understand the unique features and benefits of each.

Navigating the Challenges of Event-Based Systems
This article explores the challenges of event-based systems, including debugging complexities, ensuring event ordering, and managing data consistency. It highlights key issues such as latency, throughput, and security concerns, offering insights into overcoming these hurdles for building robust, scalable, and efficient event-driven architectures, ensuring successful implementation and operation.

Understanding AppDomains in .NET Framework and .NET 5 to 8
In the .NET Framework, AppDomains provided a secure, isolated environment for applications to run within a single process, enabling dynamic assembly loading and unloading without impacting the entire application. With the advent of .NET 5 to 8, the focus shifted towards cross-platform compatibility and microservices, leading to the deprecation of AppDomains in favor of AssemblyLoadContext for assembly management and containers for application isolation. This transition reflects modern development practices, emphasizing performance, scalability, and compatibility across different platforms. Understanding these changes is crucial for developers migrating from the .NET Framework to newer .NET versions, as it affects application structure and deployment.

Carbon Sequestration: A Vital Process for Climate Change Mitigation
Carbon sequestration is essential for mitigating climate change by capturing atmospheric CO2. It involves biological and geological methods to store carbon in vegetation, soils, oceans, and underground formations. While promising, it requires careful monitoring due to potential side effects like leakage and seismic events triggered by CO2 injection.
Understanding Carbon Credit Allowances
Carbon credit allowances play a crucial role in combating climate change through a cap-and-trade system that limits greenhouse gas emissions and permits trading of emission units. Entities like the California Air Resources Board, Regional Greenhouse Gas Initiative, and Quebec’s Cap-and-Trade System issue these allowances, supporting a significant carbon market in North America. Alongside, voluntary standards such as Verra and the Gold Standard certify projects for carbon credits, contributing to global efforts against climate change. Understanding and participating in these systems allows businesses and individuals to actively contribute to reducing carbon footprints and advancing towards a more sustainable future.
Good News for Copilot Users: Generative AI for All!
In the latest tech update, Microsoft Copilot undergoes a transformative expansion, introducing Copilot Pro for individual users and enhancing accessibility for businesses of all sizes. This marks a significant step in democratizing generative AI technology. Key developments include the general availability of Copilot for Microsoft 365 for small and medium businesses, the removal of the 300-seat minimum for commercial plans, and eligibility expansion to Office 365 E3 and E5 customers. These changes promise to revolutionize work dynamics across diverse sectors. Microsoft’s vision of integrating AI into everyday work and personal life takes a leap forward with Copilot’s evolving capabilities.

Carbon Credits 101
Carbon credits control CO2 emissions through a market mechanism, incentivizing companies to reduce their carbon footprint and invest in cleaner technologies, ultimately balancing economic growth with environmental responsibility.

SQLite and Its Journal Modes
SQLite, a popular lightweight database, offers various journal modes to manage transactions and ensure data integrity. These modes include Delete, the default mode creating a rollback file; Truncate, which speeds up transactions by truncating this file; Persist, reducing file operations by leaving the journal file inactive; Memory, for high-speed transactions using RAM; Write-Ahead Logging (WAL), enhancing concurrency and data durability; and Off, for maximum speed where data integrity is not a priority. Understanding these modes allows for optimized database performance, balancing between speed, resource usage, and data consistency, making SQLite versatile for a range of applications.

User-Defined Functions in SQLite: Enhancing SQL with Custom C# Procedures
SQLite enhances SQL by allowing the integration of user-defined functions within applications, enabling developers to extend database functionalities using their app’s programming language. Key features include scalar functions, which return a single value per row, and aggregate functions that consolidate data from multiple rows. Developers can define or override these functions using CreateFunction and CreateAggregate methods, respectively. Custom operators like glob, like, and regexp can also be defined, altering standard SQL operator behaviors. SQLite’s design ensures efficient error handling and supports full .NET debugging, streamlining the development of robust and efficient SQL custom functions.
LangChain
In the dynamic field of artificial intelligence, LangChain emerges as a pivotal framework, revolutionizing the use of large language models like GPT-3. Developed by Shawn Presser, LangChain is designed for the easy integration and application of these models in various computational tasks. This open-source framework marks a significant stride in AI and NLP, offering a modular and scalable platform for developers. Its historical roots trace back to the advent of advanced language models, addressing the need for practical application tools. LangChain finds diverse applications in areas such as customer service, content creation, and data analysis, enhancing efficiency and creativity. Its role in democratizing AI technology highlights its potential for future innovations. LangChain is not just a software framework; it’s a key player in the ongoing narrative of AI’s impact across different sectors, promising a future rich in AI-driven advancements.
Run A.I models locally with Ollama
In this insightful article, we delve into the dynamic world of the Ollama AI framework, a cutting-edge platform that runs large language models (LLMs) directly on your local machine. We explore a diverse range of models available in Ollama, each tailored to specific computational needs and applications. From the versatile Llama 2 to the coding-focused Code Llama, and the powerful Llama 2 with 70 billion parameters, this piece provides a comprehensive overview of the models you can utilize for your projects. Whether you’re a developer, a data scientist, or an AI enthusiast, this article is your guide to understanding and harnessing the power of Ollama’s extensive model library.

Understanding LLM Limitations and the Advantages of RAG
Exploring the intricacies of artificial intelligence, this article sheds light on the limitations of Large Language Models (LLMs), particularly focusing on issues like outdated information and lack of data source attribution. It juxtaposes these challenges with the innovative approach of Retrieval-Augmented Generation (RAG), which integrates real-time data retrieval with generative models, offering a more dynamic, credible, and transparent solution in the AI landscape. By highlighting the advantages of RAG over traditional fine-tuning methods in LLMs, the article underscores the importance of continuous evolution in AI technologies for enhanced reliability and accuracy in various applications.

Enhancing AI Language Models with Retrieval-Augmented Generation
Exploring Retrieval-Augmented Generation (RAG), this article delves into how it revolutionizes AI language models. RAG merges language generation with external data retrieval, enhancing response accuracy and relevance in various sectors like customer service, education, healthcare, and media.

The Steps to Create, Train, Save, and Load a Spam Detection AI Model Using ML.NET
not only demonstrates the process of creating, training, saving, and loading a spam detection AI model using ML.NET, but also emphasizes the reusability of the trained model. By following the steps in the article, you will be able to create a model that can be easily reused and integrated into your .NET applications, allowing you to effectively identify and filter out spam emails.

The Meme: A Cultural A.I Embedding
In the fascinating intersection of AI and culture, embeddings in artificial intelligence and memes share a surprising similarity. Both are methods of abstraction and distillation: AI embeddings transform complex data into lower-dimensional, meaningful forms, while memes encapsulate collective human experiences into universally relatable images and texts. This comparison not only sheds light on the nuanced capabilities of AI but also emphasizes the cultural significance of memes, offering profound insights into the evolving relationship between technology and human expression.

ONNX: Revolutionizing Interoperability in Machine Learning
ONNX: Revolutionizing Interoperability in Machine Learning The field of machine learning (ML) and artificial intelligence (AI) has witnessed a groundbreaking innovation in the form of ONNX (Open Neural Network Exchange). This open-source model format is redefining the norms of model sharing and interoperability across various ML frameworks. In this article, we explore the ONNX […]

ML vs BERT vs GPT: Understanding Different AI Model Paradigms
In the dynamic world of artificial intelligence (AI) and machine learning (ML), diverse models such as ML.NET, BERT, and GPT each play a pivotal role in shaping the landscape of technological advancements. This article embarks on an exploratory journey to compare and contrast these three distinct AI paradigms. Our goal is to provide clarity and […]

ML Model Formats and File Extensions
Machine Learning Model Formats and File Extensions The realm of machine learning (ML) and artificial intelligence (AI) is marked by an array of model formats, each serving distinct purposes and ecosystems. The choice of a model format is a pivotal decision that can influence the development, deployment, and sharing of ML models. In this article, […]

Machine Learning and AI: Embeddings
In the realms of machine learning (ML) and artificial intelligence (AI), embeddings play a crucial role. They transform complex, high-dimensional data into more manageable low-dimensional vectors, preserving essential properties. Embeddings are particularly vital in natural language processing (NLP), enabling ML models to effectively interpret text. Their creation involves sophisticated models like Word2Vec and CNNs, trained on extensive data to capture nuanced features. This article delves into the fundamentals of embeddings, underscoring their significance in advancing AI technologies

Understanding Machine Learning Models
Key Insights into Machine Learning Models Discover the fundamentals of machine learning models: their types, differences, and usage. Learn about algorithms that transform input data into insightful predictions and decisions. Explore the diversity of models, from linear regression to neural networks, and understand their unique learning styles and tasks. Grasp the essential steps of selecting, training, and deploying these models, supported by tools like scikit-learn, TensorFlow, and PyTorch. This guide serves as a concise introduction to harnessing the power of machine learning in data-driven decision making.

Support Vector Machines (SVM) in AI and ML
Understanding Support Vector Machines in AI and ML This article delves into the world of Support Vector Machines (SVM), a pivotal supervised learning technique in artificial intelligence (AI) and machine learning (ML). Originating from the groundbreaking work of Vladimir Vapnik and Alexey Chervonenkis in the 1960s, SVMs have evolved to become key tools in handling classification and regression tasks, especially in scenarios involving high-dimensional data. The article provides insights into the historical development of SVMs, including the introduction of the soft margin concept and the revolutionary kernel trick. It also explores various applications of SVMs, ranging from bioinformatics to financial analysis, highlighting their versatility and effectiveness. In conclusion, the article underscores the enduring relevance of SVMs in the rapidly evolving field of AI and ML, noting their unique strengths in model interpretability and efficiency with smaller datasets. As we continue to witness advancements in technology, SVMs remain a vital component in the data scientist’s toolkit.

Introduction to Machine Learning in C#: Spam Detection using Binary Classification
Discover the fascinating world of machine learning in C# using the ML.NET framework in this insightful article. From defining data models to implementing a spam detection system, the article provides a step-by-step guide for integrating AI technologies into .NET applications. It delves into the practicalities of setting up NUnit test projects in Visual Studio Code, enhancing the learning experience with real-world examples. The piece concludes with reflections on the potential of machine learning to revolutionize software development and a glimpse into the future of AI applications. This article is an essential read for anyone interested in the intersection of programming, technology education, and the ever-evolving landscape of artificial intelligence.

Understanding Neural Networks
Exploring the Fascinating World of Neural Networks In the ever-evolving realm of technology, neural networks stand at the forefront of innovation, driving the future of artificial intelligence (AI). These complex systems, mirroring the intricate structure of the human brain, are revolutionizing the way machines learn, process data, and make decisions. From the pioneering efforts of Warren McCulloch and Walter Pitts to the game-changing backpropagation algorithm, the journey of neural networks is a testament to human ingenuity and the relentless pursuit of knowledge. In this article, we delve into the fundamentals of neural networks, tracing their historical roots and exploring their role in modern AI. We uncover how these networks, composed of layers of interconnected nodes or neurons, analyze vast amounts of data to identify patterns and make predictions. Through a simple example of email classification, we demonstrate how neural networks can distinguish between ‘spam’ and ‘not spam,’ showcasing their practical applications in everyday life. Join us as we navigate the intricate pathways of neural networks, unveiling the mysteries of machine learning and opening doors to a future where AI shapes the fabric of our reality.

Decision Trees and Naive Bayes Classifiers
Decision Trees and Naive Bayes Classifiers Decision Trees Overview: Decision trees are a type of supervised learning algorithm used for classification and regression tasks. They work by breaking down a dataset into smaller subsets while at the same time developing an associated decision tree incrementally. The final model is a tree with decision nodes and […]

Machine Learning: History, Concepts, and Application
Exploring the Depths of Machine Learning: From Historical Roots to Modern Applications Delve into the dynamic world of Machine Learning (ML), tracing its evolution from theoretical concepts to real-world applications. This insightful piece begins with a historical perspective, highlighting Alan Turing’s seminal 1950 paper and the development of foundational algorithms. It explores early use cases, such as Arthur Samuel’s checker-playing program, pioneering speech recognition at Carnegie Mellon University, and the advent of Optical Character Recognition (OCR) systems. Discover how ML works, starting from data collection and preparation, through model selection and training, to eventual application in prediction and decision-making. The article simplifies these concepts, making them accessible to a broad audience. A practical example of an email spam detection system is presented, illustrating ML’s profound impact on our everyday lives. This article serves as a comprehensive guide, offering insights into the journey of machine learning from its early days to its current status as a cornerstone of modern technology.
Divide and Conquer: Subtle Strategies for Supercharging Your Database Performance
Embark on a whimsical journey into the world of database table partitioning with our light-hearted yet informative guide, ‘Divide and Conquer.’ We delve into the intricate art of splitting large database tables into manageable partitions, unraveling how this clever strategy can significantly boost your database’s performance. With a sprinkle of humor and a dash of practical insights, this article illuminates the often-overlooked magic of partitioning in SQL Server and PostgreSQL. Whether you’re a seasoned database administrator or a curious novice, prepare to be entertained and educated on how partitioning can transform your data management experience

Understanding AI, AGI, ML, and Language Models
Explore the realms of Artificial Intelligence (AI) and its significant subsets: Machine Learning (ML), Language Models, and the concept of Artificial General Intelligence (AGI). This excerpt offers a concise overview of how these technologies interrelate and their impact on the advancement of smart machines and human-like cognitive abilities in AI systems. AI stands as a vast domain focused on creating machines mimicking human intelligence. ML emerges as a pivotal component of AI, emphasizing data-driven learning and adaptive capabilities. Meanwhile, Language Models showcase the application of ML in processing and generating human language, a testament to the growing sophistication of AI tools. The intriguing concept of AGI takes center stage as the potential future of AI, where AI systems may one day exhibit broad and flexible intelligence, akin to human cognition. This excerpt delves into these interwoven fields, shedding light on their current states and the aspirational goals shaping the future of artificial intelligence.
PostgreSQL Full-text search using “text search vectors”
Postgres Vector Search Full-text search in PostgreSQL is implemented using a concept called “text search vectors” (or just “tsvector”). Let’s dive into how it works: Text Search Vectors (tsvector): A tsvector is a sorted list of distinct lexemes, which are words that have been normalized to merge different forms of the same word (e.g., “run” and “running”). […]

Elastic Search
Elasticsearch is a distributed, RESTful search and analytics engine capable of solving a growing number of use cases. It is a technology that is part of the Elastic Stack, along with Logstash, and Kibana, collectively known as the ELK Stack. Elasticsearch is built on top of the open-source Lucene library and provides a multi-tenant capable […]

Interplanetary File System (IPFS)
IPFS stands for the InterPlanetary File System. It is a protocol and network designed to create a peer-to-peer method of storing and sharing hypermedia in a distributed file system. IPFS was initially designed by Juan Benet and is now an open-source project with a large community of contributors. How IPFS Works In a traditional client-server […]

Blazor WebAssembly and SQLite: Unleashing the Full Potential of Client-Side Data
In the evolving panorama of contemporary web application development, a technology that has particularly caught attention is Microsoft’s Blazor WebAssembly. This powerful tool allows for a transformative approach to managing and interacting with client-side data, offering innovative capabilities that are shaping the future of web applications. Understanding Blazor WebAssembly Blazor WebAssembly is a client-side […]
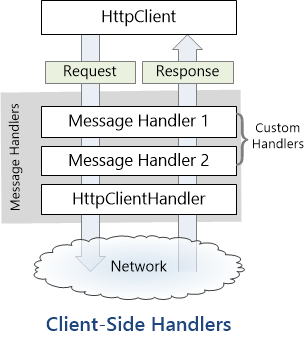
Fake it until you make it: using custom HttpClientHandler to emulate a client server architecture
Last week, I decided to create a playground for the SyncFramework to demonstrate how synchronization works. The sync framework itself is not designed in a client-server architecture, but as a set of APIs that you can use to synchronize data. Synchronization scenarios usually involve a client-server architecture, but when I created the SyncFramework, I decided […]

Hosting SQLite databases in Blazor Web Assembly targeting net 6
Blazor is a framework for building interactive client-side web UI with .NET, developed by Microsoft. It allows developers to build full-stack web applications using C# instead of JavaScript. Blazor comes in two different hosting models: 1. Blazor Server: In this model, the application runs on the server from within an ASP.NET Core app. UI updates, […]

It works, most of the time. Probabilistic errors in software
Last week, I had two presentations, during both of which I was to present an example of data synchronization using the open-source framework we developed in our office, Xari/BitFrameworks. you can read more about the framework here https://github.com/egarim/SyncFramework I practiced the demo several times and felt confident about it. After all, I was the one […]

On my GUID, common problems using GUID identifiers
A GUID (Globally Unique Identifier) is a unique reference number used as an identifier in computer systems. GUIDs are usually 128-bit numbers and are created using specific algorithms that are designed to make each GUID unique. Characteristics of GUIDs: Uniqueness: The primary characteristic of a GUID is its uniqueness. The intent of a GUID is […]
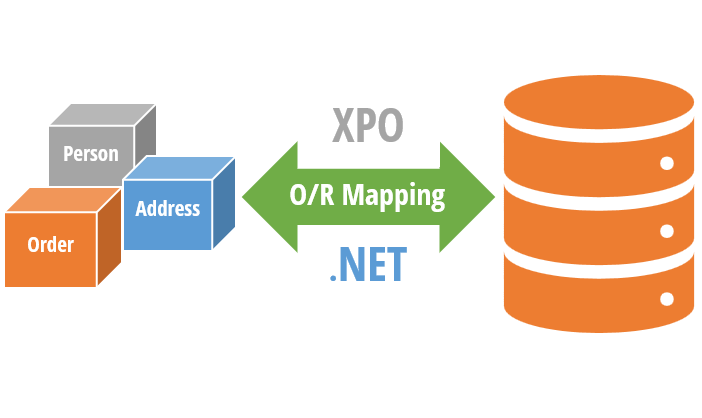
XPO, One ORM to rule them all
Let’s do a quick overview of the main features of XPO before we dive into details. XPO (eXpress Persistent Objects) is a full-featured Object-Relational Mapping (ORM) framework developed by DevExpress. It is used to provide a mapping between the relational database tables and the objects used in a .NET application. XPO allows developers […]

SOLID design pattern and XPO
SOLID is an acronym that stands for five fundamental principles of object-oriented programming and design. These principles were first introduced by Robert C. Martin (also known as Uncle Bob) and have since become a cornerstone of software development best practices. Each letter in SOLID represents a principle that, when applied correctly, leads to more maintainable […]

What is an O.R.M (Object-Relational Mapping)
ORM is a technique for converting data between incompatible type systems using object-oriented programming languages. In the context of database management, an ORM provides a way to interact with a database using objects and methods, rather than writing raw SQL queries. This allows for a higher level of abstraction, reducing the amount of repetitive and […]

ADO The origin of data access in .NET
.NET communicates with a database using ADO.NET, which provides a set of classes and interfaces for accessing and manipulating data stored in a database. ADO.NET supports various database systems, including relational databases and XML databases. ADO.NET uses the following protocols to communicate with a database: 1. OLE DB (Object Linking and Embedding, Database) – This […]

Relational database systems: the holy grail of data
RDBMS stands for Relational Database Management System. It is a type of database management system that is based on the relational model, which organizes data into tables with rows and columns, and uses relationships between tables to link data together. In an RDBMS, data is stored in tables, with each table representing a specific type […]

Alchemy Framework: 2 – Repository Structure
Alright, it’s time to start writing some code, but first, let’s decide how this project will be organized. So far, the repository structure that I’ve found most appealing is the one I used for the SyncFramework (https://github.com/egarim/SyncFramework). Here is a representation with bullet points: Repo Folder: This is the parent folder that will contain all […]

Alchemy Framework: 1 – Creating a framework for import data
Last Friday, I received a message from a dear friend and colleague, Pedro Hernandez. He asked me if I had the latest compiled version of the XPO import framework we created in our office. As it turned out, I did not have it readily available and had to search extensively for it. While conducting this […]
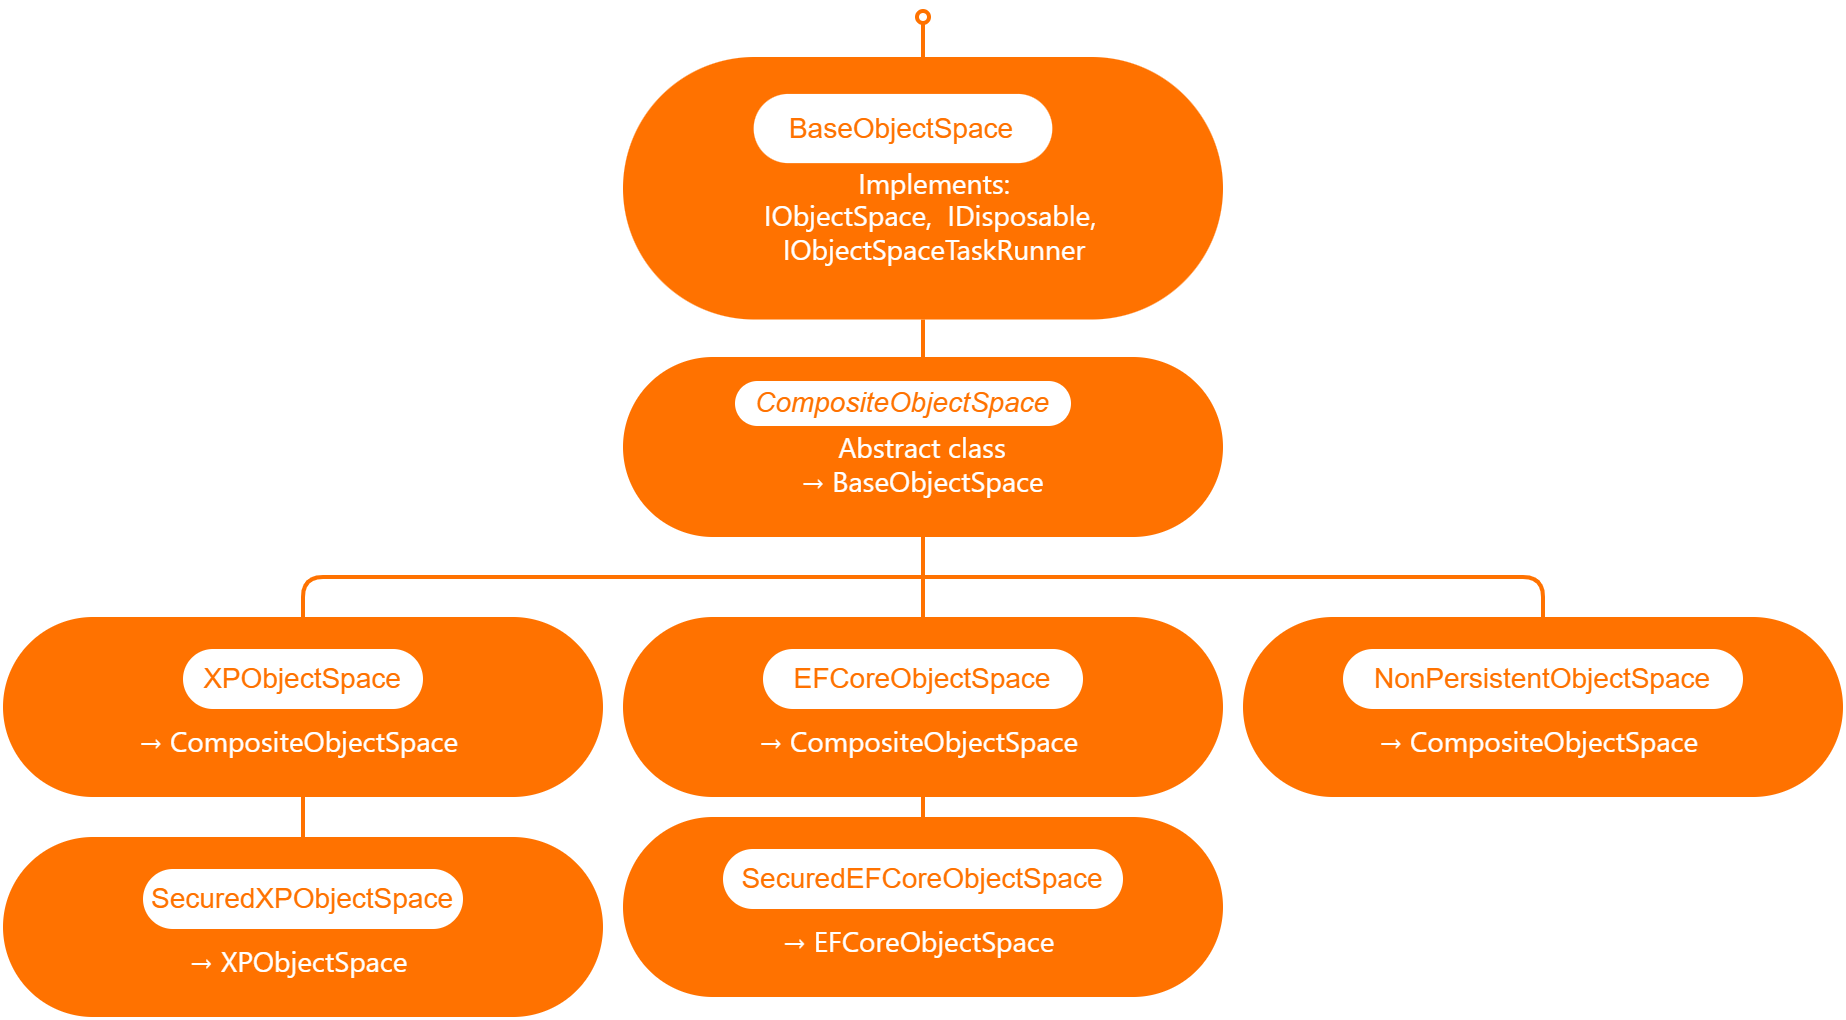
Querying external data sources in XAF
I will explain what XAF is just for the sake of the consistency of this article, XAF is a low code application framework for line of business applications that runs on NET framework (windows forms and web forms) and in dotnet (windows forms, Blazor and Web API) XAF is laser focus on productivity, DevExpress team […]

P.O.U.N.D stack (Postgres, Oqtane, Ubuntu & DotNet)
A stack in software development refers to a collection of technologies, tools, and frameworks that are used together to build and run a complete application or solution. A typical stack consists of components that handle different aspects of the software development process, including frontend, backend, databases, and sometimes even the hosting environment. A stack is […]

the myth of “it is better not to use a framework”
based on my experience with numerous application frameworks, I regard XAF as the most efficient in delivering robust solutions quickly and with minimal code. Our company has trained over 100 software firms in utilizing eXpressApp Framework (XAF) and XPO, leading me to believe that the issue typically stems from three factors: The illusion of productivity […]

S3 storage: how to use a custom domain names by using Apache as proxy
Cloud Storage Cloud storage is useful for mobile and web apps because it provides an efficient and scalable way to store and retrieve data from anywhere in the world. With cloud storage, mobile and web apps can easily scale their storage needs up or down depending on usage patterns. This means that developers don’t need […]

4 – Running Oqtane as a Ubuntu Linux service
In this post we will learn how to publish Oqtane as a Linux service, but before we continue let’s do a recap of what we have learned so far How to compile Oqtane for an O.S other than Windows: HTTPs://www.jocheojeda.com/2023/03/20/1-compiling-oqtane-3-4-to-target-ubuntu-linux/ The process of publish Oqtane installation files :https://www.jocheojeda.com/2023/03/20/2-publishing-oqtane-3-4-to-target-ubuntu-linux/ How to change the binding URLs for […]
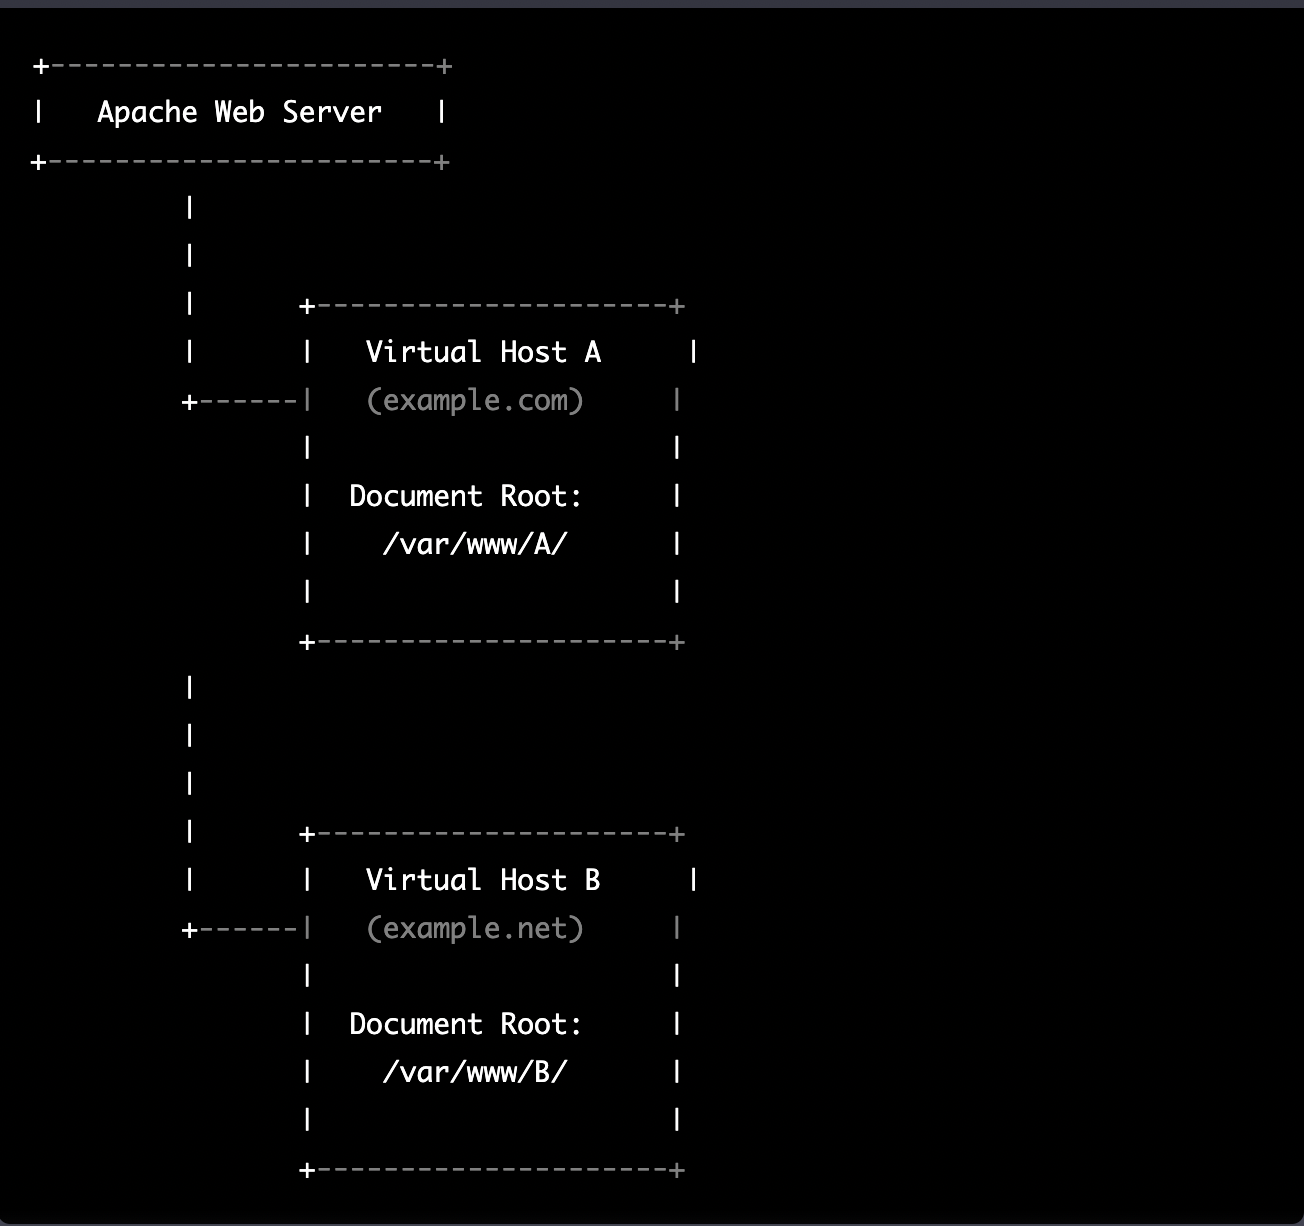
3 – Running multiple instances of oqtane for virtual hosting environments in apache webserver
Virtual hosting is a technique used by Apache (and other web servers) to host multiple websites on a single server. With virtual hosting, a single physical server can host multiple virtual servers, each with its own domain name, IP address, and content. Virtual hosting can be implemented in two ways: Name-based virtual hosting: In this […]
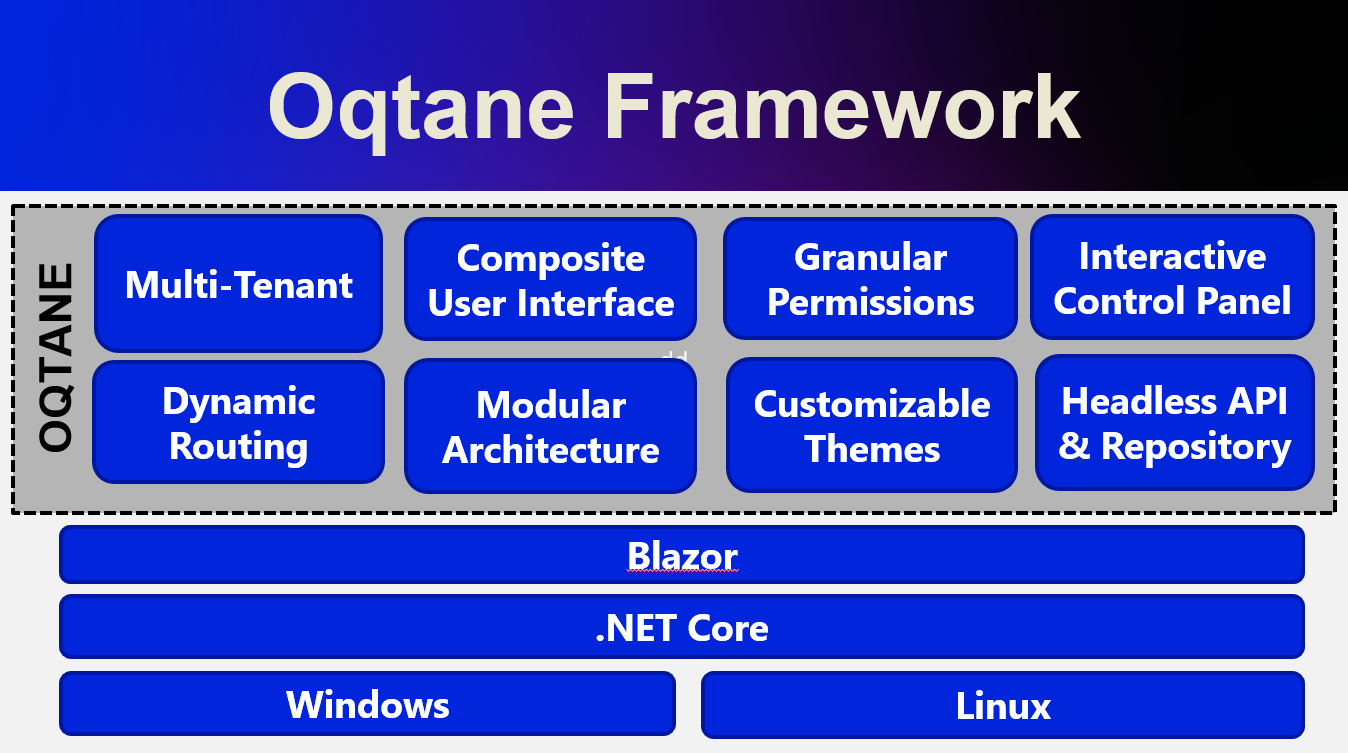
2-publishing oqtane 3.4 to target Ubuntu Linux
In the preceding blog post, we explored the process of running Oqtane on Ubuntu Linux and successfully confirmed its functionality. Now, let us delve deeper and proceed to package the installation binaries specifically tailored for Ubuntu Linux deployment. As a frequent publisher of Blazor applications to Linux servers, I find the process to be quite […]
1-Compiling oqtane 3.4 to target Ubuntu Linux
Oqtane is an open-source, modular application framework built on top of ASP.NET Core, a popular web development platform created by Microsoft. Oqtane is inspired by DotNetNuke (DNN), another content management system and web application framework, but it is designed specifically to take advantage of the benefits of ASP.NET Core, such as cross-platform compatibility, improved performance, […]

Creating an activity stream using Postgres 15
An activity stream is a data format used to represent a list of recent activities performed by an individual or group on a social network, web application, or other platform. It typically includes information such as the type of activity (e.g., posting a status update, commenting on a post), the person or entity performing the […]
Running DotNet applications as a service in macOS
Running an application as a service in macOS can be accomplished using a tool called launchd. launchd is a system-wide daemon manager that is built into macOS. It can be used to run applications automatically at startup, or on a schedule. In this article, we’ll show you how to run an application as a service […]
Entity Framework Core & lazy loading
In Entity Framework 7, lazy loading is a technique used to delay the loading of related entities until they are actually needed. This can help to improve the performance of an application by reducing the amount of data that is retrieved from the database upfront. To implement lazy loading in EF7, the “virtual” modifier is […]
5 Good Practices for Integration Testing with NUnit
Integration tests are a crucial part of any software development process, as they help ensure that different parts of a system are working together correctly. When writing integration tests, it is important to follow best practices in order to ensure that your tests are effective and maintainable. Here are a few good practices for integration […]
Moving to apple silicon as a DotNet Developer
ARM (Advanced RISC Machine) is a popular architecture for mobile devices and other low-power devices. Microsoft has supported ARM architectures in the .NET framework for many years, and this support has continued with the release of .NET 6 and .NET 7. In .NET 6 and 7, support for ARM architectures has been improved and expanded […]

How to wrap your synchronous implementation in an asynchronous implementation.
In this article, we will be discussing why it is sometimes useful to wrap your synchronous implementation in an asynchronous implementation. Introduction Async programming is an important paradigm in modern software development, allowing you to perform long-running tasks without blocking the calling thread. Async programming is particularly useful in scenarios where the operation may take […]

Implementing asynchronous interfaces
In this article, we will be discussing how to define an async interface based on a synchronous interface example. Introduction Async interfaces are useful when you need to perform asynchronous operations within your application. Async interfaces allow you to define methods that return a Task object instead of a value, allowing you to use the […]

AspNetCore Kestrel: change your application port using a configuration file
Modern AspNetCore applications use the built-in web server kestrel,this server is usually bound to the localhost address using the ports 5000 and 5001 for http and https. But what if you want to run 2 applications in the same server? then you have a problem because if you use the default ports one of the […]

Blazor: Use tag helpers to include java scripts and CSS in your html header
Sometime we want to reuse our Blazor components in another apps, the best way to do this is to create a razor library, this process of create a razor library is not different from create a normal class library to share code. There is only one exception, razor components might need to reference JavaScript or […]
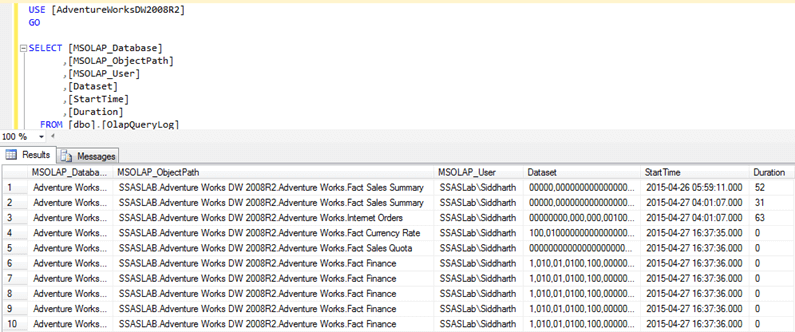
Log XPO queries in a Netcore app (3,5,6)
The LogLevel section in the appsettings.json file does not affect the .NET Framework tracing mechanism, which is used by XPO to log the queries, still we have a few work arounds for a Netcore app We can implement our own logger as shown here https://docs.devexpress.com/XPO/403928/best-practices/how-to-log-sql-queries#xpo-logger-net We can set the value of the logging switch by […]
Implementing database synchronization with entity framework core
Ok, so far, our synchronization framework is only implemented for an in-memory database that we use for testing purposes. Now let’s implement a different use case, lets add synchronization functionality to an entity framework core DbContext. As I explained before, the key part of synchronizing data using delta encoding is to be able to track […]

SyncFramework – Adding network support
So far, all our test exists inside the same process, so they communicate through variables, in real-life scenarios nodes won’t exist in the same process and most of the time not even in the same location. The easiest and most standard way to implement client-server communication in the dotnet world is a rest API, so […]

SyncFramework – Planning the first implementation
Well, it’s time to create our first implementation, first, we need a place to store the deltas generated in the process of tracking changes in a data object. To keep the Implementation simple, we will create a delta store that saves the deltas in memory. This delta store can also be used for testing purposes […]

Synchronization Framework Base Classes
Now that we have defined the bases contracts necessary for synchronization, we can define some base classes that implement those contracts, the main idea behind these base classes is to, later on, add the possibility to inject configurations with .net dependency injection. Let’s start with the delta implementation https://github.com/egarim/SyncFramework/blob/main/src/BIT.Data.Sync/Delta.cs /// <summary> /// An implementation of […]

Let’s write a Synchronization Framework in C#
Ok in the last post we defined the conceptual parts of a synchronization framework, now let’s create the code that represents those parts Delta https://github.com/egarim/SyncFramework/blob/main/src/BIT.Data.Sync/IDelta.cs /// <summary> /// Represents a transaction made to the database /// </summary> public interface IDelta { double Epoch { get; set; } /// <summary> /// Who created the delta […]

Parts of a Synchronization Framework
In the last post, we talked about what are deltas and how by using them we can synchronize data structures. So, in this post, I will describe the necessary parts needed to implement Delta-based synchronization, let’s start Data Object: any database, object, graph, or file system that we are tracking for synchronization Delta: a delta is […]
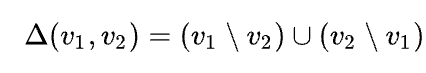
Data synchronization in a few words
To Synchronize data is one of the most challenging tasks out there, especially if you are working with LOB applications There are many ways to synchronize data, the most common technique is to compare records by modification date and then merge the data to create a master record. Here the main problem is that you […]
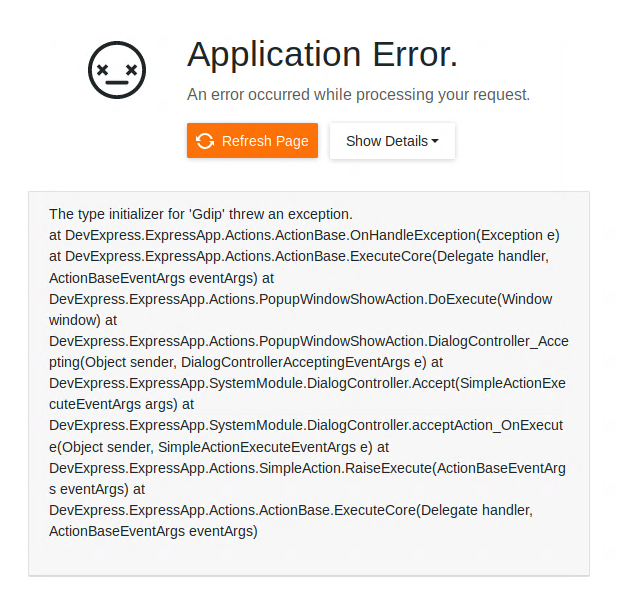
How to fix “The type initializer for ‘Gdip’ threw an exception” caused by the netcore framework depencency, when you run a Xaf Blazor App on ubuntu linux 18.04
If you are running Xaf Blazor in ubuntu 18.04 you might have seen the following exception The type initializer for ‘Gdip’ threw an exception. at DevExpress.ExpressApp.Actions.ActionBase.OnHandleException(Exception e) at DevExpress.ExpressApp.Actions.ActionBase.ExecuteCore(Delegate handler, ActionBaseEventArgs eventArgs) at DevExpress.ExpressApp.Actions.PopupWindowShowAction.DoExecute(Window window) at DevExpress.ExpressApp.Actions.PopupWindowShowAction.DialogController_Accepting(Object sender, DialogControllerAcceptingEventArgs e) at DevExpress.ExpressApp.SystemModule.DialogController.Accept(SimpleActionExecuteEventArgs args) at DevExpress.ExpressApp.SystemModule.DialogController.acceptAction_OnExecute(Object sender, SimpleActionExecuteEventArgs e) at DevExpress.ExpressApp.Actions.SimpleAction.RaiseExecute(ActionBaseEventArgs eventArgs) at DevExpress.ExpressApp.Actions.ActionBase.ExecuteCore(Delegate handler, ActionBaseEventArgs […]

How to monitor your aspnet core application on Ubuntu Linux
Here are some recommendations to host your new shiny aspnet core app on Linux in this case in Ubuntu 18.04 First, create a user with the name aspnetapp sudo adduser myaspnetapp after executing the command, you will have a new folder in your home directory the folder will have the same name as your […]

Install TestCafe in Ubuntu 18.04
Lately, I have been playing a lot with TestCafe which is a testing tool for website, there are 2 parts of TestCafe, the first part is TestCafe studio which is a tests editor tool where you can create or edit new tests that will be eventually used in the TestCafe test runner, both TestCafe and […]

Ubunto add missing resolution (18.04.4 LTS && 20.04 LTS)
1) Determine Name of Display sudo xrandr -q In my case, I will add the missing resolution to the display HDMI-2 (below you can see that I highlight all the current resolutions for this display) 2) Run command to calculate VESA CVT mode lines by given resolution cvt 2560 1080 (in this case […]

How I got started with machine learning using ML.NET
first tweet in the morning Lets check Jerome https://www.youtube.com/results?search_query=ML.NET Downloaded the visual studio extension https://dotnet.microsoft.com/apps/machinelearning-ai/ml-dotnet/model-builder?WT.mc_id=ondotnet-c9-cxa

How to delete all temporary files from (bin,obj,packages) your solution folder
Sometimes you want to send a zip with your visual studio solution or project, but after you archive your files you realize that the file size is huge, well worry no more you can use the following script (a .bat file) to clear all the temporary files in your visual studio solution just save the […]

Replacing WCF with AspNetCore Rest API as transport layer for XPO
I have been using XPO from DevExpress since day one. For me is the best O.R.M in the dot net world, so when I got the news that XPO was going to be free of charge I was really happy because that means I can use it in every project without adding cost for my […]

How to fix Error MSB4044 The “FilterAssemblies” task was not given a value for the required parameter “DesignTimeBuild”
If you updated your visual studio to version 16.2.0 and you are using MSBuildSdkExtras your project won’t compile. so to fix this problem (this is a temporary fix). You need to add the following lines to your csproj <PropertyGroup Label=”Android DesignTimeBuild error workaround”> <DesignTimeBuild>false</DesignTimeBuild> </PropertyGroup>

How to automatically show a read me file after installing a NuGet
There are times when you have been working on your new exciting project and it looks so good that you just want to release it as soon as possible so the world can be blessed with your new NuGet package but wait your new library is a complex library and require special setup instructions after […]

How to exclude package dependencies in a NuGet package
Sometimes during the development stage, you need to add package references to your project that are only needed either during the development or compilation stage but they are not actually required by the emitted assembly. So how do we avoid to flood the end project with package dependencies that are actually not needed? Well the […]
Brevitas Application Framework (Alpha Release )
First, let’s start with that is Brevitas, if someone asks me (the creator) I will say that Brevitas is an application framework for Xamarin Forms that you can use to develop L.O.B (Line of Business) Applications. Creating mobile apps using MVVM pattern is fun, but it requires an incredible amount of time, I have been […]
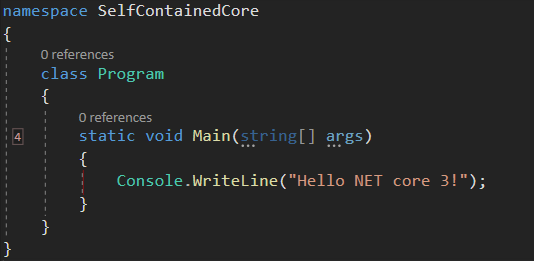
How to create a self contained netcore 3 console application
I have a new project that I want to deploy and I don’t want it to depend on the dot net framework, so I decided to create a self-contained executable. At first, I thought it was an easy process and don’t get me wrong, it is, but I could not find all the pieces of […]

Exposing your XPO ORM using GraphQL dotnet
Exposing your XPO ORM using GraphQL Note: you can download the full source code for this article in my GitHub repository In the past few years, I have been working on developing mobile applications, in the mobile world most of the applications will consume some type of data service, the main problem here is how […]

Xamarin & XPO System.NotSupportedException: Encoding 1252 data could not be found. Make sure you have correct international codeset assembly installed and enabled.
You know that moment when you are about to deliver your next mobile app, everything is working fine in your development environment but once you release the app to your customers you start getting errors like the one below You think, what happened? everything was running fine on my development environment. Well, lets said that […]

XPO for Xamarin Forms Webinars (English & Spanish)
XPO is Developer Express Object Relational Mapping (ORM) tool for the .NET framework that allows you to rapidly create a data access layer for your applications.XPO 18.2, which is a mature and stable version of XPO that runs on DotNet, DotNetCore and Xamarin. This course will teach you how to get the best performance out […]
XPO para Xamarin Forms, May 15 2019 (Lenguaje Español)
En el seminario web, aprenderá a aprovechar los conocimientos existentes de XPO y a usarlos para desarrollar aplicaciones móviles con Xamarin Forms Fecha Miercoles 15, 2019, 10:00 A. M hora de los Angeles (UTC-7) Duracion 3 Horas Lenguaje Español ¿Qué obtendrá después del webinar? Acceso al repositorio privado de GitHub con ejemplos de código para […]
XPO for Xamarin Forms, May 22, 2019 (English language)
In the webinar, you will learn how to leverage your existing knowledge of XPO and using it to develop mobile applications using Xamarin Forms Date May 22, 2019, 10:00 A.M Los Angeles time (UTC -7) Language English What will you get after the webinar? Access to the private GitHub repository with code examples for each subject […]
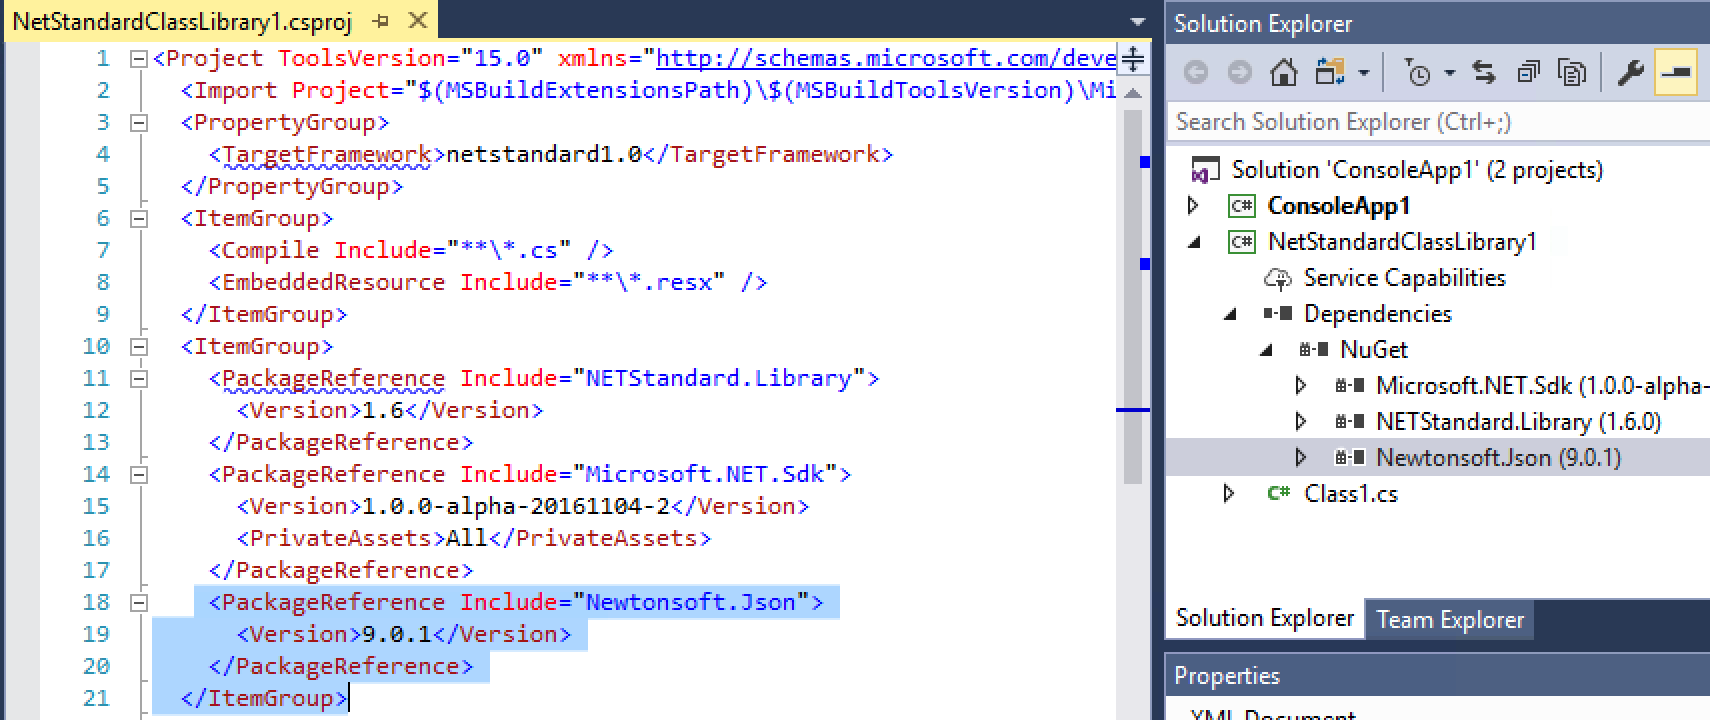
Migrating XAF projects to the new version of csproj (SDK project VS2017)
For a while now I have been trying to create a framework for XAF (yes I know XAF is already a framework) but it was too difficult to handle the different version of XAF and upgrade the solution from version to version. Luckily for me, DevExpress team decided to publish all their DLLs as nuget packages, you […]
XAF javascript callback made easy
Sometimes we need to have clientside events and handle them on the server side code behind, that in a simple asp.net web page is really easy, you just have to execute a javascript that executes an HTTP request to the server. Now the question is, how do we do that in XAF? Well, the concept is […]
Xamarin Forms UWP / UAP Broad File System Access (Permissions)
For a long time now, I have wanted to access the file system when I create a Xamarin Forms UAP/UWP application but that was actually impossible … till now. After the Windows 10 build 17134 update its possible to access the broad file system, the approach is not straight forward. To gain access to the file system […]
CodeRush Entity Framework Code Templates
Don’t waste your time writing boilerplate code, just use Code Rush from DevExpress Entity Framework Class (shortcut efc) Entity Framework Property (shortcut efpr) Entity Framework Property (shortcut efnp) Entity Framework Collection (shortcut efcol) Entity Framework extensions (shortcut efext) Entity Framework ModelBuilder Association (shortcut efrom) You can download all these amazing code templates here [download […]
What is an application framework?
Let’s try to define what is an application framework, for that we will check how famous website defines the term “Application Framework” From Wikipedia In computer programming, an application framework[1] consists of a software framework used by software developers to implement the standard structure of application software.[2] From techopedia An application framework is a software library that provides a fundamental structure to support the development […]
Code Rush Template for Xamarin forms bindable property
From time to time I realize that a lot of the stuff I’m writing is repetitive and complex, so that is the perfect time to create a new code rush custom template, behold the new template xfbp (xamarin forms bindable property). Download the template here [download id=”211″] Do you want to see it in action? […]
XAF FilterController case insensitive search
Sometimes you are asked by a customer to implement a functionality that you have already created in the past from someone else. In this case, a customer and dear friend from Italy asked me “Jose, can we make the XAF filter case insensitive?” And my answer was yes, I have done in the past for […]
BIT.Xpo.Observables Nuget
An observable implementation of XpCollection and XPPageSelector. After 15 years, DevExpress has finally made XPO available free-of-charge. If you’re not familiar with XPO, you can learn more about its feature set here. If you’ve used XPO in the past or are familiar with capabilities, you will love this. As we already know a Xamarin ListView […]
XPO and database replication
After 15 years of working with XPO, I have seen many tickets asking if XPO is capable of doing data replication and all the time DevExpress team answer those tickets saying that replication its out of the scope of XPO and that it’s actually true. So, to start talking about database replication lets try to […]
XPO POST 5: Layered Architecture
There is nothing than inspire me more to write a blog post that a regular Saint Petersburg day and by regular, I mean windy, cold, dark and rainy, but don’t get me wrong I love this city but when the weather is too nice as it was this past summer is hard to focus on […]
XPO POST 4: Connection Strings
When XPO was first released it supported MSSQL Server and MS Access as the main database systems, most of the examples and documentation did not specify how XPO connected to the database, at that time it looks like the connection to the database happened like magic. There was little to none information about how to […]
XPO POST 3: The XPO Providers
An XPO provider is a class that XPO uses to communicate natively to the RDBMS, most of these providers are subclasses of the base provider for SQL provider that lives in DevExpress.Data assembly. Why is important to know how each provider works? here are some of the reasons: You can change the default column type […]
XPO POST 2: The processor architecture
Now that we have installed XPO is time to talk a little bit about processor architecture. If you are using a 64 bits processor you can compile your .net application with the following architectures Any CPU x64 x86 XPO depends on ADO.NET DataAdapters in order to connect to the different databases and ADO.NET depends on […]
XPO POST 1: How to obtain the XPO library
Well, let’s start at the beginning. How do I gain access to use XPO, well there are several install XPO on your next DotNet project, here is a list of them. If you own any of DevExpress license you already have access to XPO you can see the available licenses here Download the NuGet package: XPO […]
How to install all the nuget references to run XPO with SQLite on Xamarin Android, iOS and Forms with a single package
When I got the news that XPO will run on DotNetCore, NetStandard and Xamarin I was super excited about all the new possibilities and to be able to port all the years of experience with XPO to the Xamarin platform. A few days after the announcement of XPO being able to run on DotNetCore and […]